
BNB Price Could See Major Drawdown If It Fails To Stay Above This Support

Share:
Predictions Markets
See what traders are focused on

BNB price started a fresh decline from $320 resistance zone. The price is now retesting the $290 support and is at risk of more downsides.
- BNB price is gaining bearish momentum from the $320 resistance.
- The price is now trading below $310 and the 100 simple moving average (4 hours).
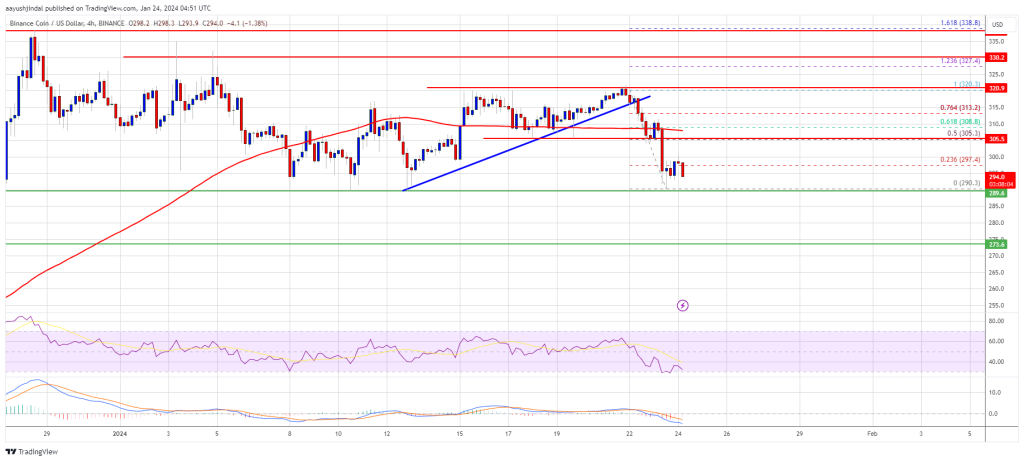
- There was a break below a key bullish trend line with support at $315 on the 4-hour chart of the BNB/USD pair (data source from Binance).
- The pair might continue to move down if it fails to stay above the $290 support.
BNB Price Takes Hit
In the past few days, BNB price made more than three attempts to clear the $320 resistance zone. However, the bears remained active and protected more gains.
As a result, there was a bearish reaction below the $315 level, like Bitcoin and Ethereum. There was a break below a key bullish trend line with support at $315 on the 4-hour chart of the BNB/USD pair. The pair even declined below the $300 level and tested the key support at $290.
A low is formed near $290.3, and the price is now struggling to correct higher. BNB price is now trading below $310 and the 100 simple moving average (4 hours). Immediate resistance is near the $298 level or the 23.6% Fib retracement level of the recent decline from the $320 swing high to the $290 low.
Source: BNBUSD on TradingView.com
The next resistance sits near the $305 level. It is close to the 50% Fib retracement level of the recent decline from the $320 swing high to the $290 low. A clear move above the $305 zone could send the price further higher. In the stated case, BNB price could test $320. A close above the $320 resistance might set the pace for a larger increase toward the $335 resistance. Any more gains might call for a test of the $350 level.
More Downsides?
If BNB fails to clear the $305 resistance, it could continue to move down. Initial support on the downside is near the $290 level.
The next major support is near the $285 level. The main support sits at $272. If there is a downside break below the $272 support, the price could drop toward the $250 support. Any more losses could initiate a larger decline toward the $220 level.
Technical Indicators
4-Hours MACD – The MACD for BNB/USD is gaining pace in the bearish zone.
4-Hours RSI (Relative Strength Index) – The RSI for BNB/USD is currently below the 50 level.
Major Support Levels – $290, $285, and $272.
Major Resistance Levels – $298, $305, and $320.
In This News
Coins

$ 63.91K
+0.99%
$ 1.79K
+2.49%
$ 575.61
+0.93%
$ 0.00...361

$ 213.96


Predictions Markets
See what traders are focused on
Share:
In This News
Coins
$ 63.91K
+0.99%$ 1.79K
+2.49%$ 575.61
+0.93%$ 0.00...361
$ 213.96
Predictions Markets
See what traders are focused on
Share: