Bitcoin Signal That Has Predicted Every Bottom Before A Price Explosion Has Just Triggered Again

Share:
Crypto analyst CryptoTice flags a recurring 14-month timing pattern that marked Bitcoin bottoms after 2014, 2018 and 2022 and says the same 14-month window has aligned again in 2026. Historically the signal preceded large upward expansions (major rallies); analyst cites repriced risk, removed leverage and cooled sentiment as supporting market conditions, but warns timing alone doesn't guarantee an immediate breakout. Implication for crypto market: potential early-stage transition from bear to bull for Bitcoin, relevant to market cycle analysis, token timing and investor positioning.
Predictions Markets
See what traders are focused on

Bitcoin may be approaching another pivotal point in its long-term market cycle, according to a recent analysis shared by crypto analyst @CryptoTice on X. The analyst argues that a time-based signal that historically appeared at major market bottoms has triggered again, a development he suggests has previously preceded large upward expansions in price.
A 14-Month Timing Pattern That Has Marked Bitcoin Bottoms
The signal highlighted by CryptoTice centers on a recurring 14-month period that has historically followed Bitcoin’s most significant market downturns. In the chart attached to the analyst’s post, this timeframe appears repeatedly across several market cycles, each instance marked by a red segment labeled “14 Months” followed by a large green expansion box representing the next upward move.
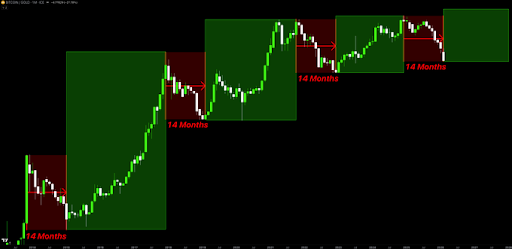
The pattern begins with the 2014 market cycle. After the prolonged decline that followed the 2013 peak, Bitcoin spent roughly fourteen months consolidating before establishing a durable bottom. According to the chart, the market then transitioned into a powerful rally that carried prices into the next major bull phase.
A similar sequence appeared again after the 2018 bear market. The chart illustrates another fourteen-month stretch between the bottoming phase and the beginning of a major upward trend. Once that period concluded, Bitcoin entered the rally that eventually drove the market to new highs during the 2020–2021 cycle.
The third example referenced in the chart occurs after the 2022 market downturn. Again, the timing window highlighted by the analyst spans approximately fourteen months before the market structure shifted upward.
In each case, the chart visualizes a comparable structure: a defined time interval following a bear-market low, followed by a strong expansion phase. CryptoTice claims that the same timing alignment has now appeared again in 2026.
Why Analysts Say This Bitcoin Signal Could Matter
The analyst argues that the current cycle has now reached the same 14-month timing window that historically aligned with previous Bitcoin market bottoms. This timing condition alone does not confirm a rally. Instead, it acts as a structural prerequisite that has repeatedly appeared before major upward movements.
The reasoning behind the signal focuses on broader market dynamics. According to the analysis, several underlying conditions have already unfolded during this period. Market risk has been repriced following previous volatility, excessive leverage within the system has been removed, and overall sentiment has cooled significantly compared to the peak of the previous cycle.
When these factors combine with the historical timing structure, the analyst argues that the market environment begins to resemble previous transition points between bear phases and major bull markets. However, CryptoTice emphasizes that time alignment alone does not guarantee an immediate breakout. Instead, he frames the current moment as a potential opportunity window. If the historical pattern repeats as it did after 2014, 2018, and 2022, the analyst believes the market could once again be approaching the early stage of a major expansion cycle for Bitcoin.


Read More

Bitcoin (BTC) Enters a Critical Zone: Will Buyers Fuel a Breakout or Surrender $60K?