
Bitcoin Price Could Be Near a Major Bottom, Historic Metrics Suggest

Share:
Bitcoin is stabilizing near the $58,000–$60,000 demand zone after a sharp correction from yearly highs, with Cantor Fitzgerald noting BTC is about 252 days past its 2025 peak and down roughly 51%. Key on-chain metrics — MVRV Z-Score falling below +2 and the Adjusted Sell-side Risk Ratio in historical accumulation territory — show cooling valuation and supply removal by long-term holders, and analysts say reclaiming $65,000 would open a run toward $70,000 while a break below current support risks $54,000, framing a crypto on-chain accumulation and adoption narrative.
Predictions Markets
See what traders are focused on

Bitcoin price could be approaching a major market bottom as multiple on-chain indicators begin flashing signals that have historically appeared near previous cycle lows. After months of sustained selling pressure and a sharp decline from yearly highs, BTC has started stabilizing near the critical $60,000 support zone.
Although short-term sentiment remains cautious, long-term data paints a more constructive picture. Valuation premiums are cooling, selling pressure continues to decline, and long-term holders appear increasingly reluctant to distribute coins at current levels. As Bitcoin attempts to build a base above major support, traders are beginning to ask whether the current consolidation could mark the foundation of the next major move.
MVRV Z-Score Signals Valuation Reset
Bitcoin’s MVRV Z-Score has recently fallen below the +2 standard deviation level after spending much of the previous cycle in elevated territory. Historically, readings above +2 have reflected overheated market conditions and excessive unrealized profits across the network. A move below this threshold often signals that valuation premiums are cooling and market conditions are returning to equilibrium.
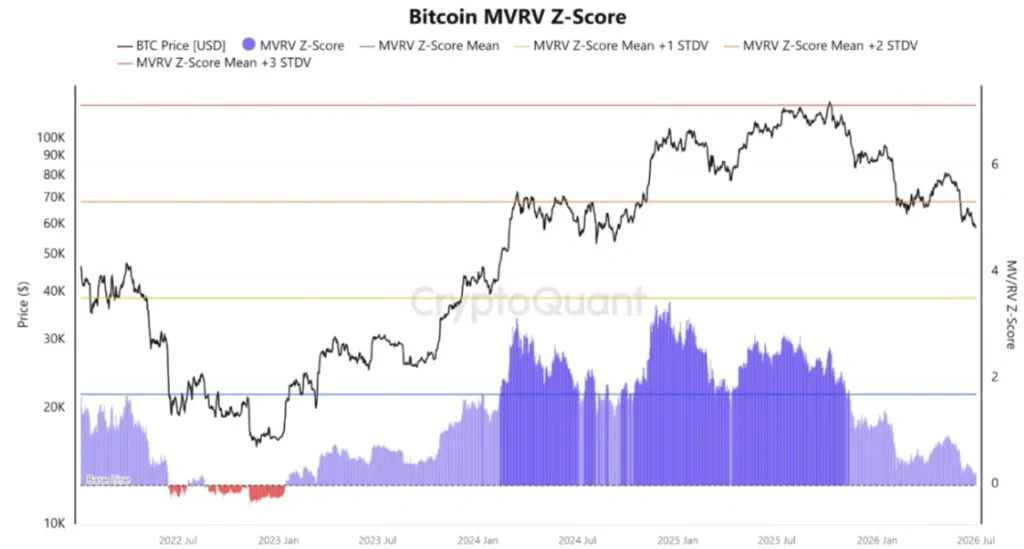
Importantly, the metric remains well above historical undervaluation zones, suggesting Bitcoin has not entered full capitulation territory. Instead, the current environment appears more consistent with a market reset than the beginning of a prolonged bear market.
Sell-Side Risk Ratio Enters Accumulation Territory
Another important on-chain metric supporting the bullish case is Bitcoin’s Adjusted Sell-side Risk Ratio. The indicator has fallen into historically low territory, levels that previously appeared during major accumulation periods in 2019, 2020, and 2023. Such readings indicate that realized profits and losses have become relatively small compared to Bitcoin’s overall market value.
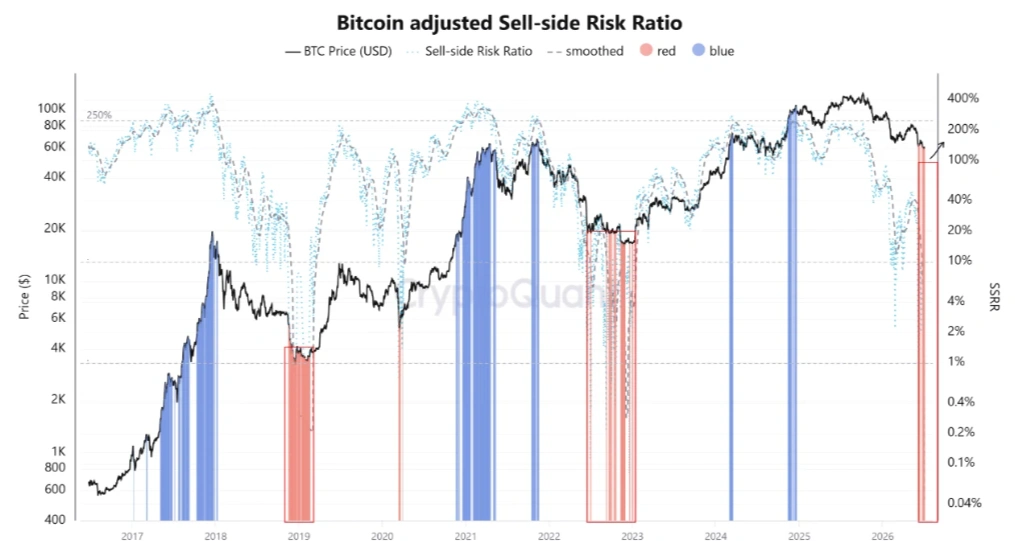
In practical terms, investors appear increasingly unwilling to sell at current prices, while long-term holders continue removing supply from the market. Historically, these periods have often preceded renewed upside momentum.
Bitcoin Price Analysis: Analysts See Early Bottom Formation
Bitcoin price continues trading near the major $58,000-$60,000 demand zone after suffering a prolonged correction from its yearly highs. BTC breaks down from a multi-month ascending structure after facing strong rejection near the $84,000 resistance area. Since then, the market has produced a series of lower highs and lower lows, confirming the broader corrective trend.
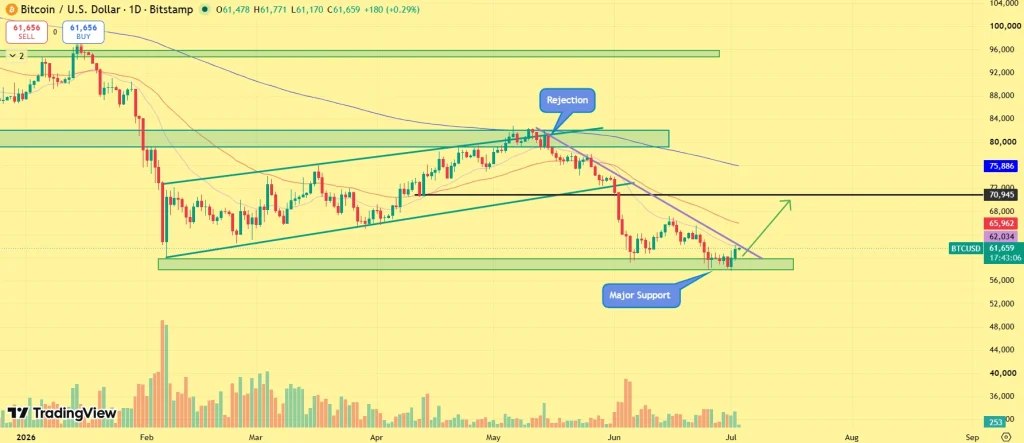
However, analysts note that the recent price action is beginning to resemble a bottoming structure rather than an active distribution phase. Repeated defenses of the $58,000 support region suggest buyers continue absorbing supply at lower levels. The decline in downside momentum and improving on-chain conditions further strengthen the accumulation narrative.
The first bullish confirmation would likely arrive if Bitcoin reclaims the $65,000 resistance level. A breakout above this area could trigger renewed buying interest and open the door toward the $70,000 region. A breakdown below the current support zone could invalidate the developing recovery structure and expose BTC to further downside toward the $54,000 region.
Cantor Sees Bitcoin Bottom Forming Later This Year
Adding to the accumulation narrative, analysts at Cantor Fitzgerald believe Bitcoin may be entering the later stages of its current correction cycle. Historical cycle analysis suggests previous Bitcoin bear markets typically established their lows several months after major peaks.
If historical patterns continue to play out, some analysts believe the current cycle could potentially bottom later this year. While such projections remain speculative, they reinforce the growing view that Bitcoin may be closer to a long-term bottom than the beginning of a new bear market.
Bottom Line
Bitcoin’s price action may still appear fragile, but several historical indicators are beginning to suggest that downside risks are becoming increasingly limited. Cooling valuation metrics, declining sell-side pressure, and strong support near $60,000 all point toward a possible accumulation phase.
As long as Bitcoin continues holding its major support zone, traders will closely watch whether improving on-chain signals can eventually translate into a broader market recovery.
In This News
Coins

$ 62.99K
-0.03%
$ 0.00316
+0.66%
$ 0.0138
+5.12%

$ 0.00228
+1.20%


Predictions Markets
See what traders are focused on
Share:
In This News
Coins
$ 62.99K
-0.03%$ 0.00316
+0.66%$ 0.0138
+5.12%$ 0.00228
+1.20%Predictions Markets
See what traders are focused on
Share: