BTC/USDT Spot CVD Chart: May 14 Volume and Order Flow Analysis
Share:
As of May 14, the BTC/USDT Spot Cumulative Volume Delta (CVD) chart combines a Volume Heatmap and segmented CVD lines—yellow for $100–$1,000 trades and brown for $1M–$10M—to map order flow, liquidity zones and retail versus institutional participation. The chart offers real-time crypto trading signals to detect shifts in buying or selling pressure, identify support and resistance from high-volume price levels, and is most useful for short-term traders and scalpers rather than as a standalone indicator of market direction.
Predictions Markets
See what traders are focused on

BitcoinWorld
BTC/USDT Spot CVD Chart: May 14 Volume and Order Flow Analysis
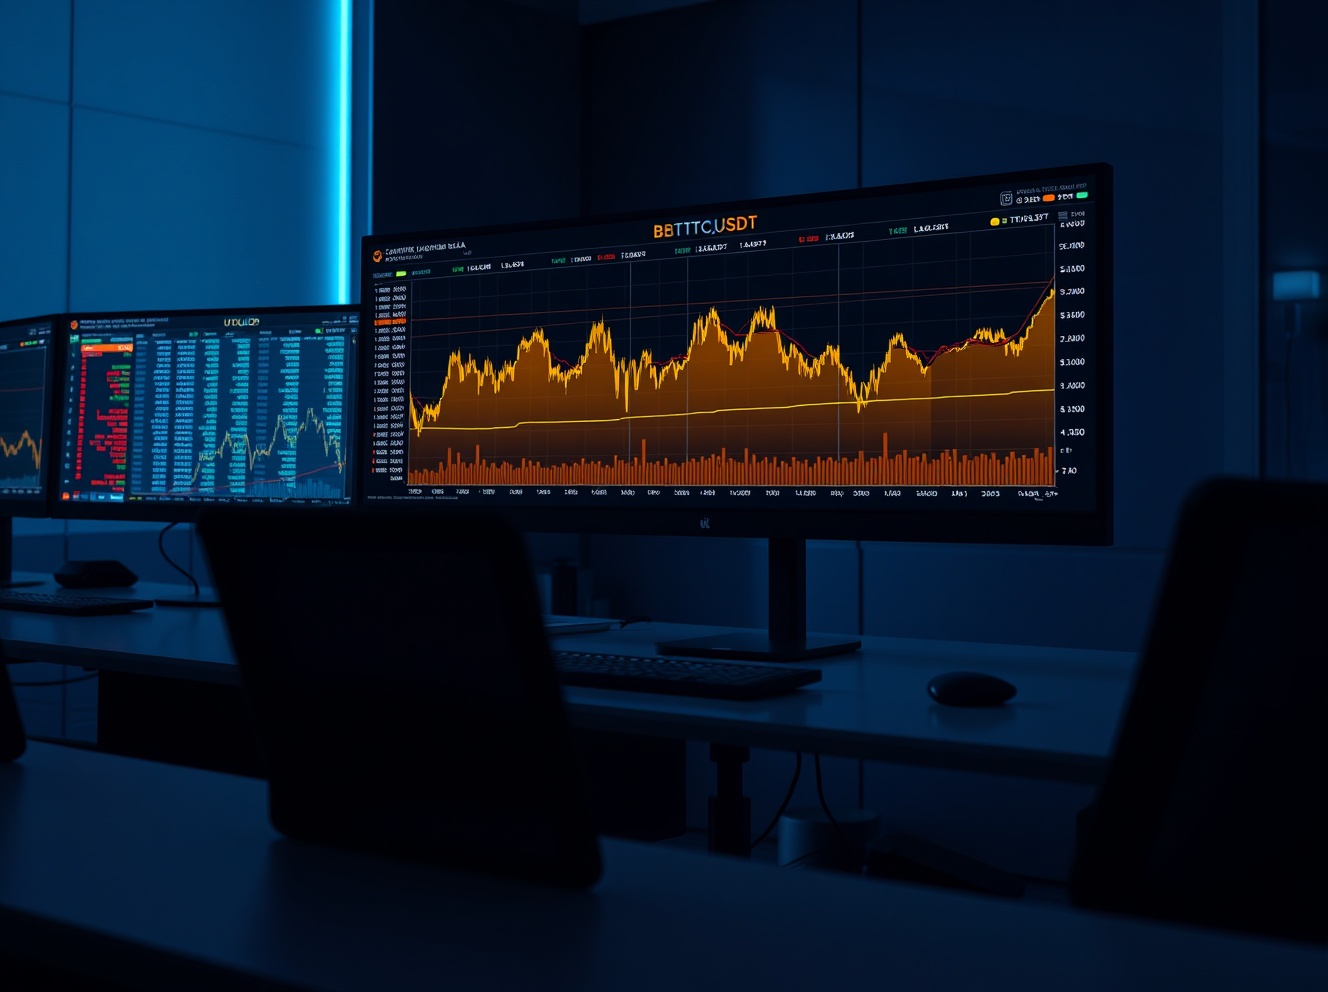
As of 5:00 a.m. UTC on May 14, the Spot Cumulative Volume Delta (CVD) chart for the BTC/USDT trading pair offers a detailed look at order book dynamics and trading activity. The chart, which combines a Volume Heatmap with CVD data, helps traders identify key price levels and shifts in buying or selling pressure.
Understanding the Volume Heatmap
The Volume Heatmap tracks trading volume at specific price levels. When the price lingers in a particular range or experiences significant movement, the background color brightens. These brighter areas often act as potential support or resistance levels, as they represent zones where substantial trading activity has occurred. For BTC/USDT, this can help traders anticipate where the price might react based on historical volume concentration.
Reading the Cumulative Volume Delta (CVD)
The Cumulative Volume Delta indicator shows the net difference between buy and sell orders, categorized by trade size. As buy orders increase, the corresponding colored line rises. The chart uses distinct colors to represent different order sizes:
- Yellow line: Orders between $100 and $1,000
- Brown line: Large orders between $1 million and $10 million
This segmentation allows traders to see whether retail or institutional-sized orders are driving the market. A rising yellow line suggests smaller retail traders are accumulating, while a rising brown line indicates large-scale institutional activity. Divergences between these lines can signal potential reversals or confirm existing trends.
Why This Matters for Traders
The Spot CVD chart provides real-time insight into order flow, which is critical for short-term trading decisions. By monitoring the volume heatmap and CVD together, traders can:
- Identify areas of high liquidity that may act as support or resistance.
- Detect shifts in buying or selling pressure before they appear on price charts.
- Differentiate between retail and institutional participation in the market.
For Bitcoin traders, understanding these dynamics can improve entry and exit timing, especially during periods of low volatility or sudden price moves.
Conclusion
The Spot CVD chart for BTC/USDT as of May 14 provides a granular view of order book activity. By analyzing the volume heatmap and CVD lines, traders can gain a clearer picture of market sentiment and potential price levels. As with all technical indicators, this data is most useful when combined with broader market analysis and risk management strategies.
FAQs
Q1: What does the Cumulative Volume Delta (CVD) measure?
A1: CVD measures the net difference between buy and sell orders in the order book. It shows whether buying or selling pressure is dominant at a given time, segmented by trade size.
Q2: How can the Volume Heatmap help with trading?
A2: The Volume Heatmap highlights price levels where significant trading volume has occurred. These zones often act as support or resistance because they represent areas where many orders were executed.
Q3: Is the Spot CVD chart useful for long-term investors?
A3: The Spot CVD chart is primarily used by short-term traders and scalpers due to its focus on real-time order flow. Long-term investors may find it less useful for strategic decisions, though it can confirm broader market trends.
This post BTC/USDT Spot CVD Chart: May 14 Volume and Order Flow Analysis first appeared on BitcoinWorld.


Read More

Bitcoin gets a green light from a reliable momentum gauge. Here are key levels to watch