Bitcoin Strengthens Again as Market Positions for Another Wave of Gains

Share:
Bitcoin price has risen above $92,000, testing significant resistance at $94,000. If it breaks this level, potential gains could target $95,850 and beyond. Key support is established at $92,000, with the next major support near $91,200.
Predictions Markets
See what traders are focused on

Bitcoin price started a fresh increase above $92,000. BTC is now testing the key barrier at $94,000 and might attempt an upside break.
- Bitcoin started a fresh increase above the $92,000 zone.
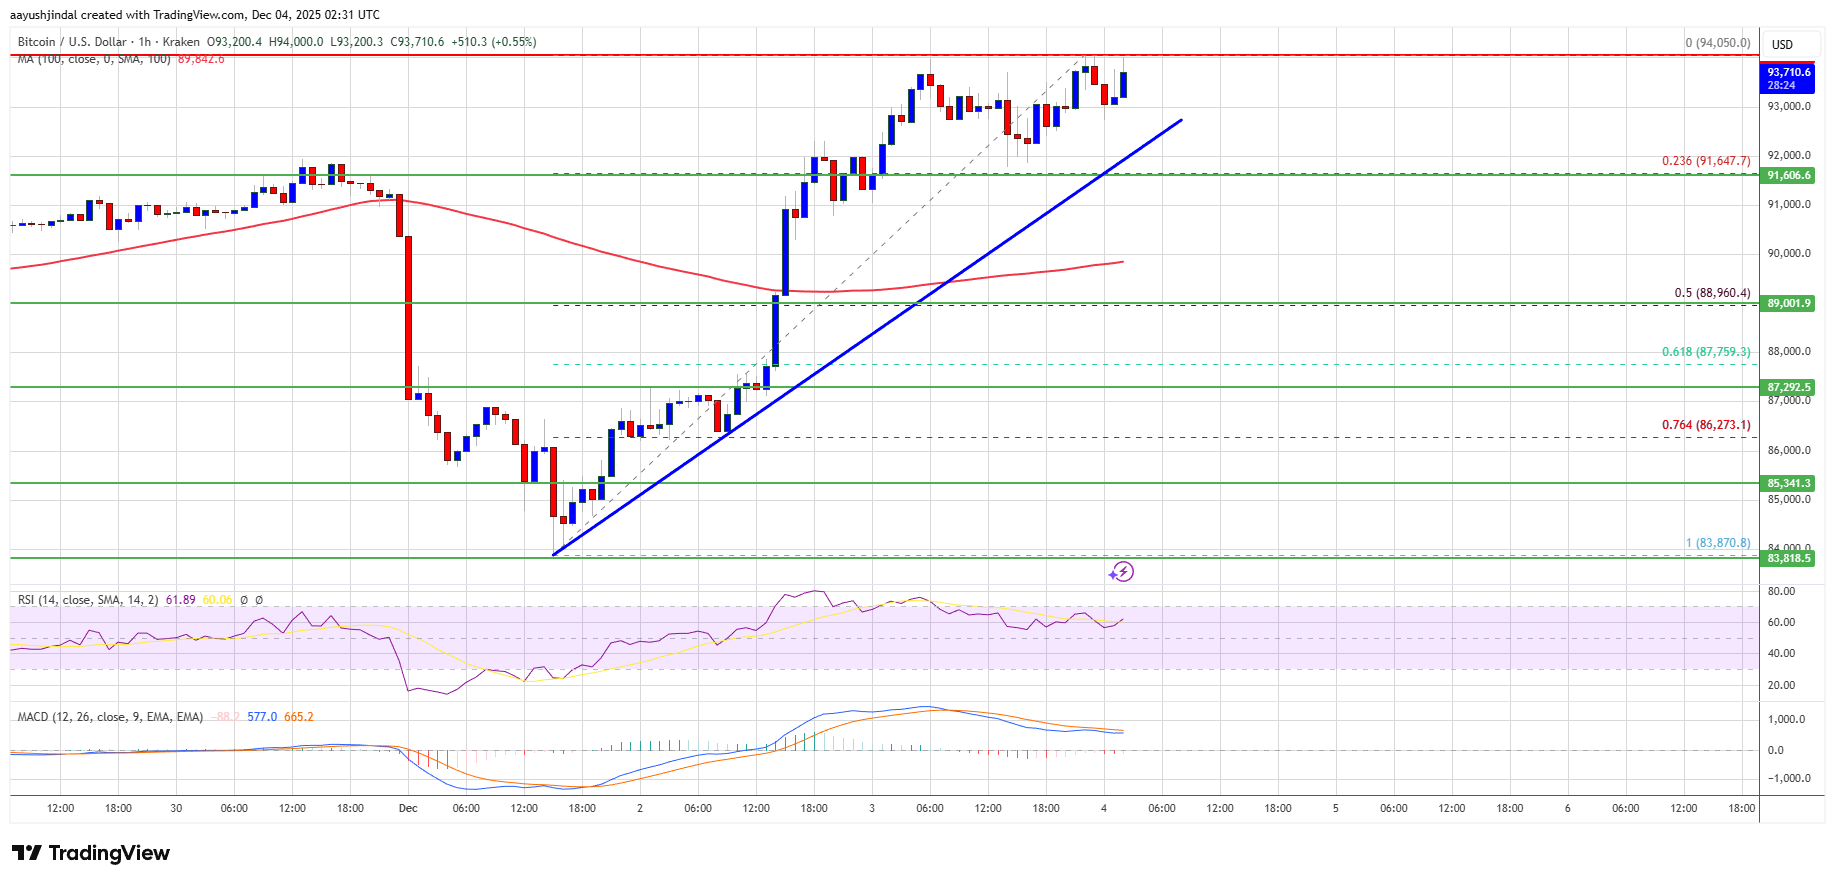
- The price is trading above $91,500 and the 100 hourly Simple moving average.
- There is a bullish trend line forming with support at $92,000 on the hourly chart of the BTC/USD pair (data feed from Kraken).
- The pair might continue to move up if it settles above the $94,000 zone.
Bitcoin Price Extends Gains
Bitcoin price managed to stay above the $88,000 zone and started a fresh increase. BTC gained strength for a move above the $88,800 and $92,000 levels.
There was a clear move above the $92,500 resistance. A high was formed at $94,050 and the price is now testing an important barrier. It is still above the 23.6% Fib retracement level of the upward move from the $83,870 swing low to the $94,050 high.
Bitcoin is now trading above $92,500 and the 100 hourly Simple moving average. Besides, there is a bullish trend line forming with support at $92,000 on the hourly chart of the BTC/USD pair.
If the bulls remain in action, the price could attempt another increase. Immediate resistance is near the $94,000 level. The first key resistance is near the $94,200 level. The next resistance could be $95,000. A close above the $95,000 resistance might send the price further higher. In the stated case, the price could rise and test the $95,850 resistance. Any more gains might send the price toward the $96,500 level. The next barrier for the bulls could be $97,200 and $98,000.
Downside Correction In BTC?
If Bitcoin fails to rise above the $94,000 resistance zone, it could start another decline. Immediate support is near the $92,000 level and the trend line. The first major support is near the $91,200 level.
The next support is now near the $88,850 zone or the 50% Fib retracement level of the upward move from the $83,870 swing low to the $94,050 high. Any more losses might send the price toward the $87,500 support in the near term. The main support sits at $86,500, below which BTC might accelerate lower in the near term.
Technical indicators:
Hourly MACD – The MACD is now gaining pace in the bullish zone.
Hourly RSI (Relative Strength Index) – The RSI for BTC/USD is now above the 50 level.
Major Support Levels – $92,000, followed by $91,200.
Major Resistance Levels – $94,000 and $95,000.


Read More

Strategy’s Biggest-Ever Bitcoin Sale Fuels FTX Crash Comparison, But There Is a Catch