Bitcoin Eyeing $112,000 After Bullish Double Bottom Breakout, Analyst Says

Share:
Predictions Markets
See what traders are focused on

After a slight weekend slump that saw Bitcoin (BTC) dip to $106,600, the leading cryptocurrency has recovered most of its losses and is currently trading close to the $110,000 level. With bullish momentum building, several crypto analysts now believe that BTC may be on track to hit a new all-time high (ATH) in the coming days.
Bitcoin To Surge To $112,000? Analyst Says Yes
According to a recent CryptoQuant Quicktake post by contributor ibrahimcosar, Bitcoin is forming a classic bullish pattern on the hourly chart – the double bottom. The analyst described this setup as “one of the strongest reversal signals” in technical analysis.
Ibrahimcosar explained that this pattern signals a weakening of bearish pressure, with buyers poised to regain control of the market. The first bottom of this formation was observed on May 23 at $106,800, followed by a second low on May 25 at $106,600.
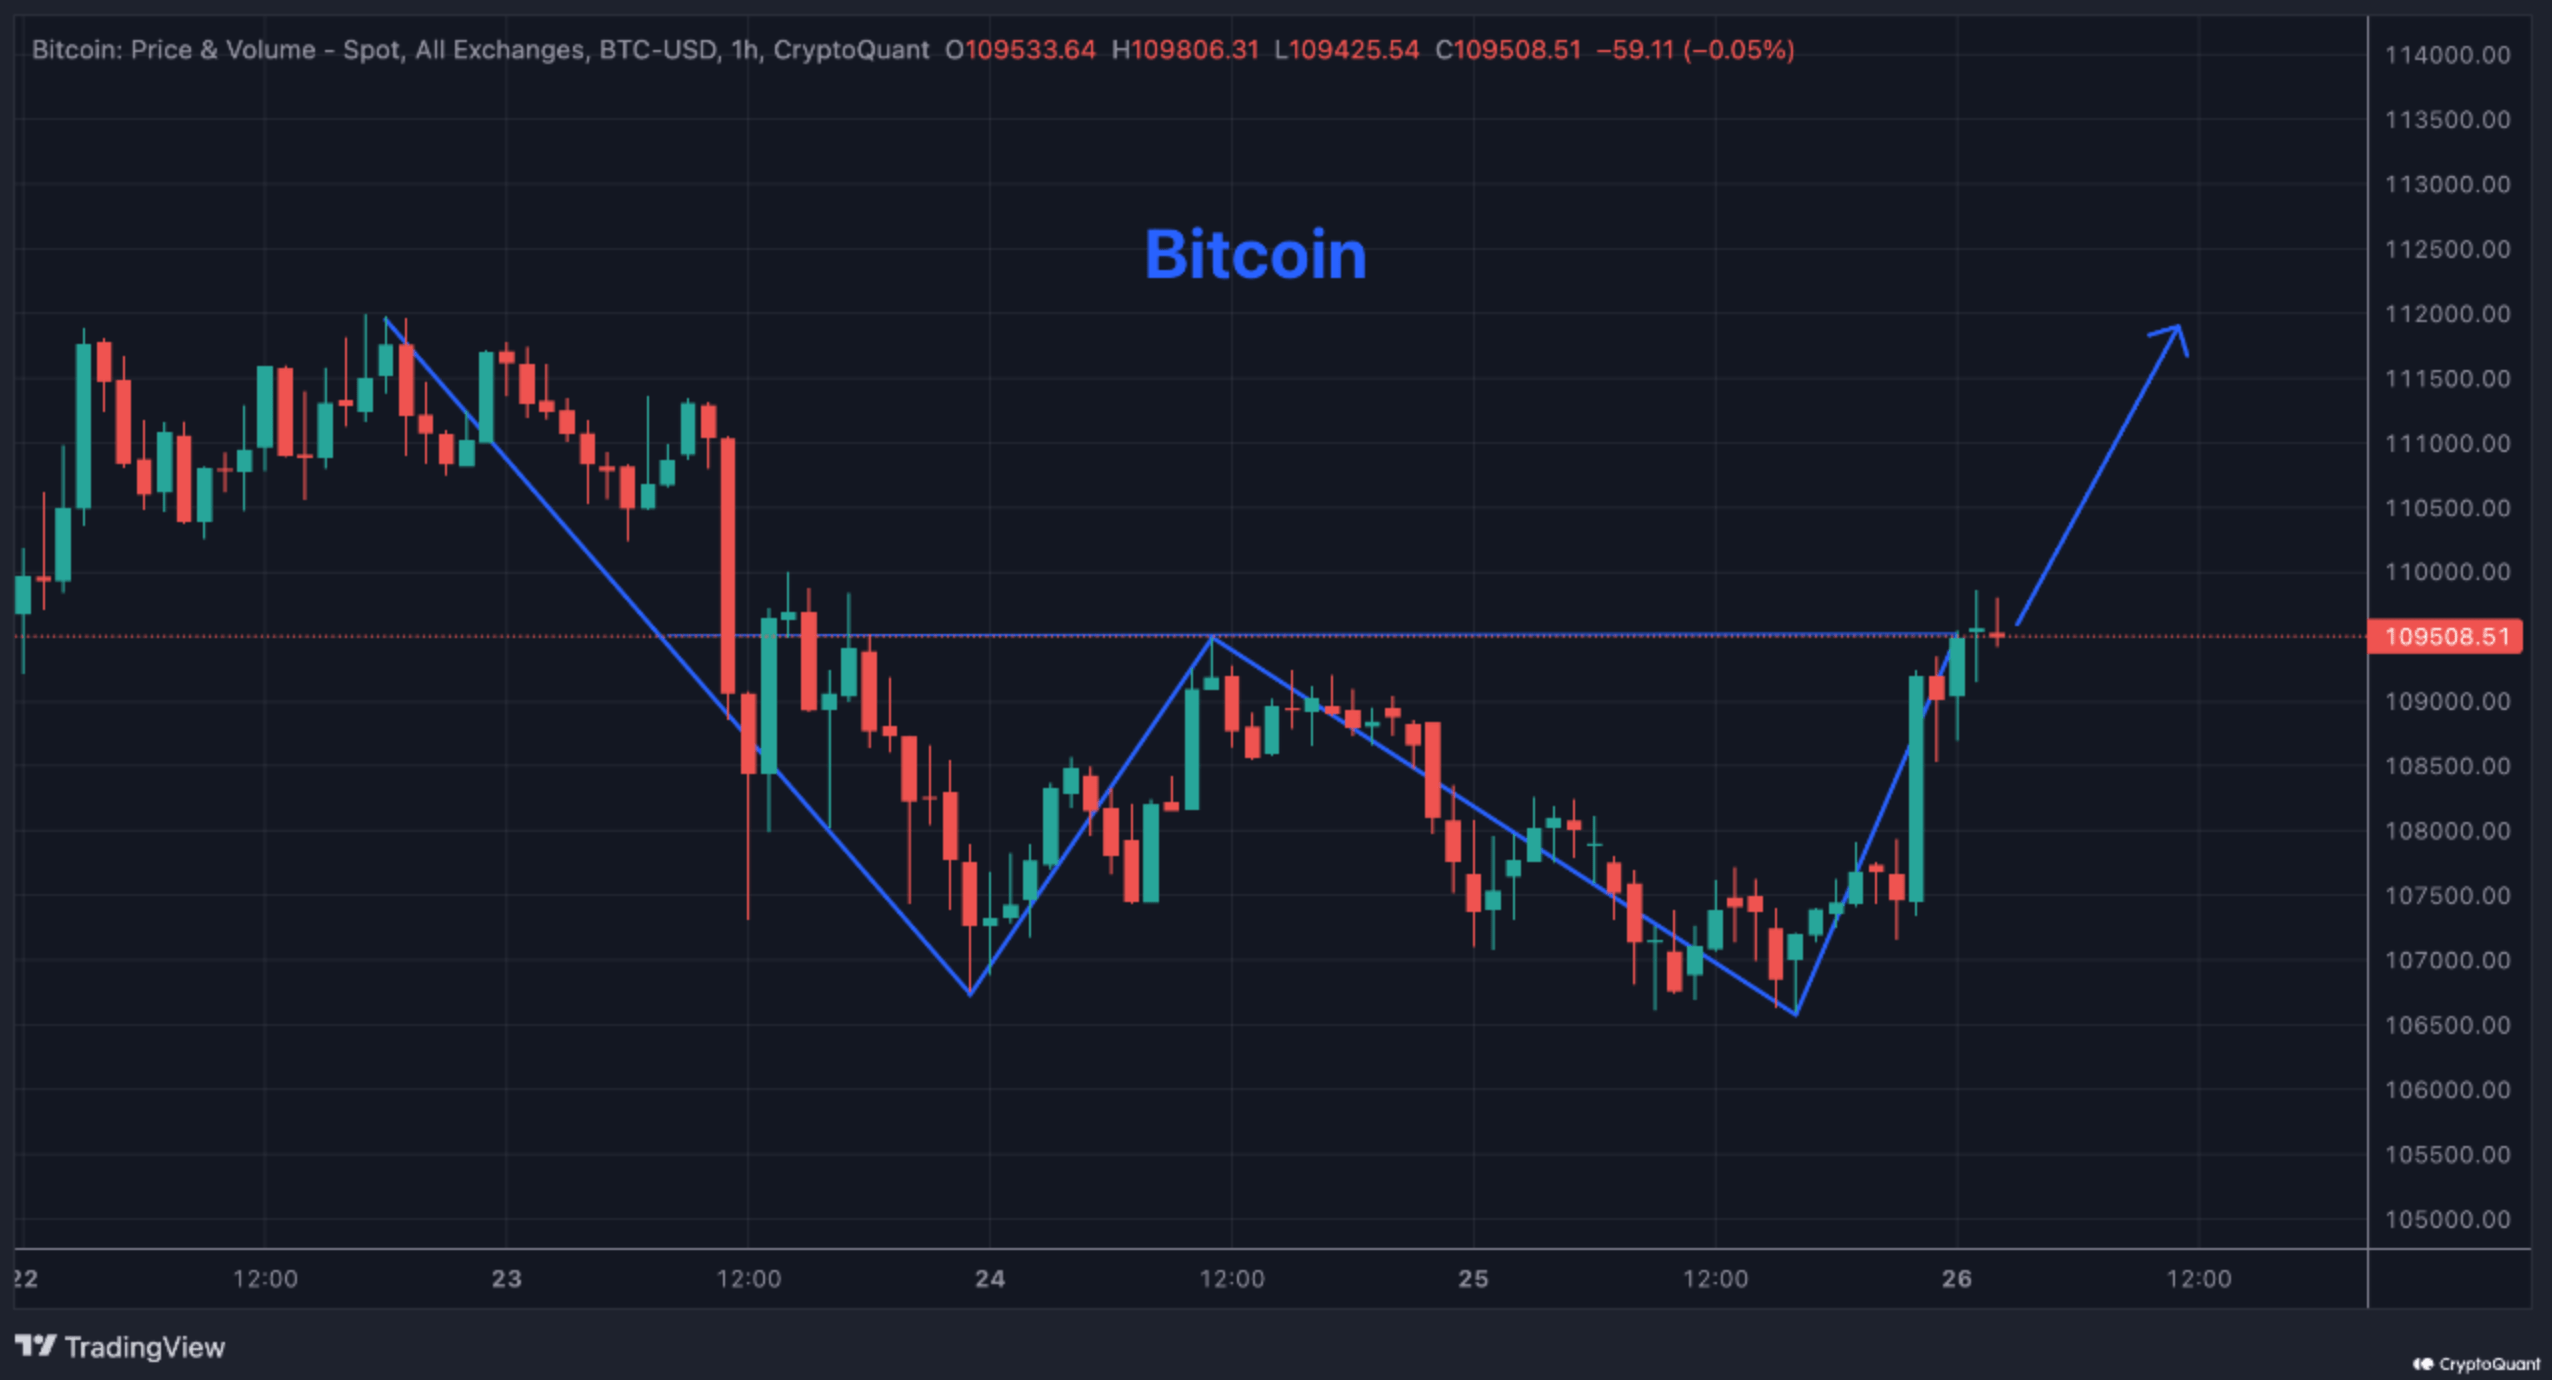
For the uninitiated, the double bottom is a bullish reversal chart pattern that forms after a downtrend, characterized by two distinct lows at a similar level with a moderate peak – called neckline – in between. According to the CryptoQuant contributor, the current neckline is around $109,000.
At the time of writing, Bitcoin is hovering just above this neckline, confirming the breakout. Importantly, the breakout was accompanied by a surge in trading volume, which analysts interpret as a sign of robust bullish momentum.
If $109,000 holds as support, then price levels beyond $112,000 could be on the horizon. The analyst explained in their Quicktake post:
Double bottoms are where the market says: ‘We’ve sold enough.’ When buyers defend the second bottom, it sends a message: Now it’s our turn. But remember, not every pattern plays out. Know your risk, make your decision.
Fellow analyst Ali Martinez echoed this sentiment in a recent post on X, sharing the following BTC hourly chart that highlights a breakout from the recent downtrend. According to Martinez, Bitcoin is now targeting the $110,000 level and potentially higher.

Good Days Ahead For BTC
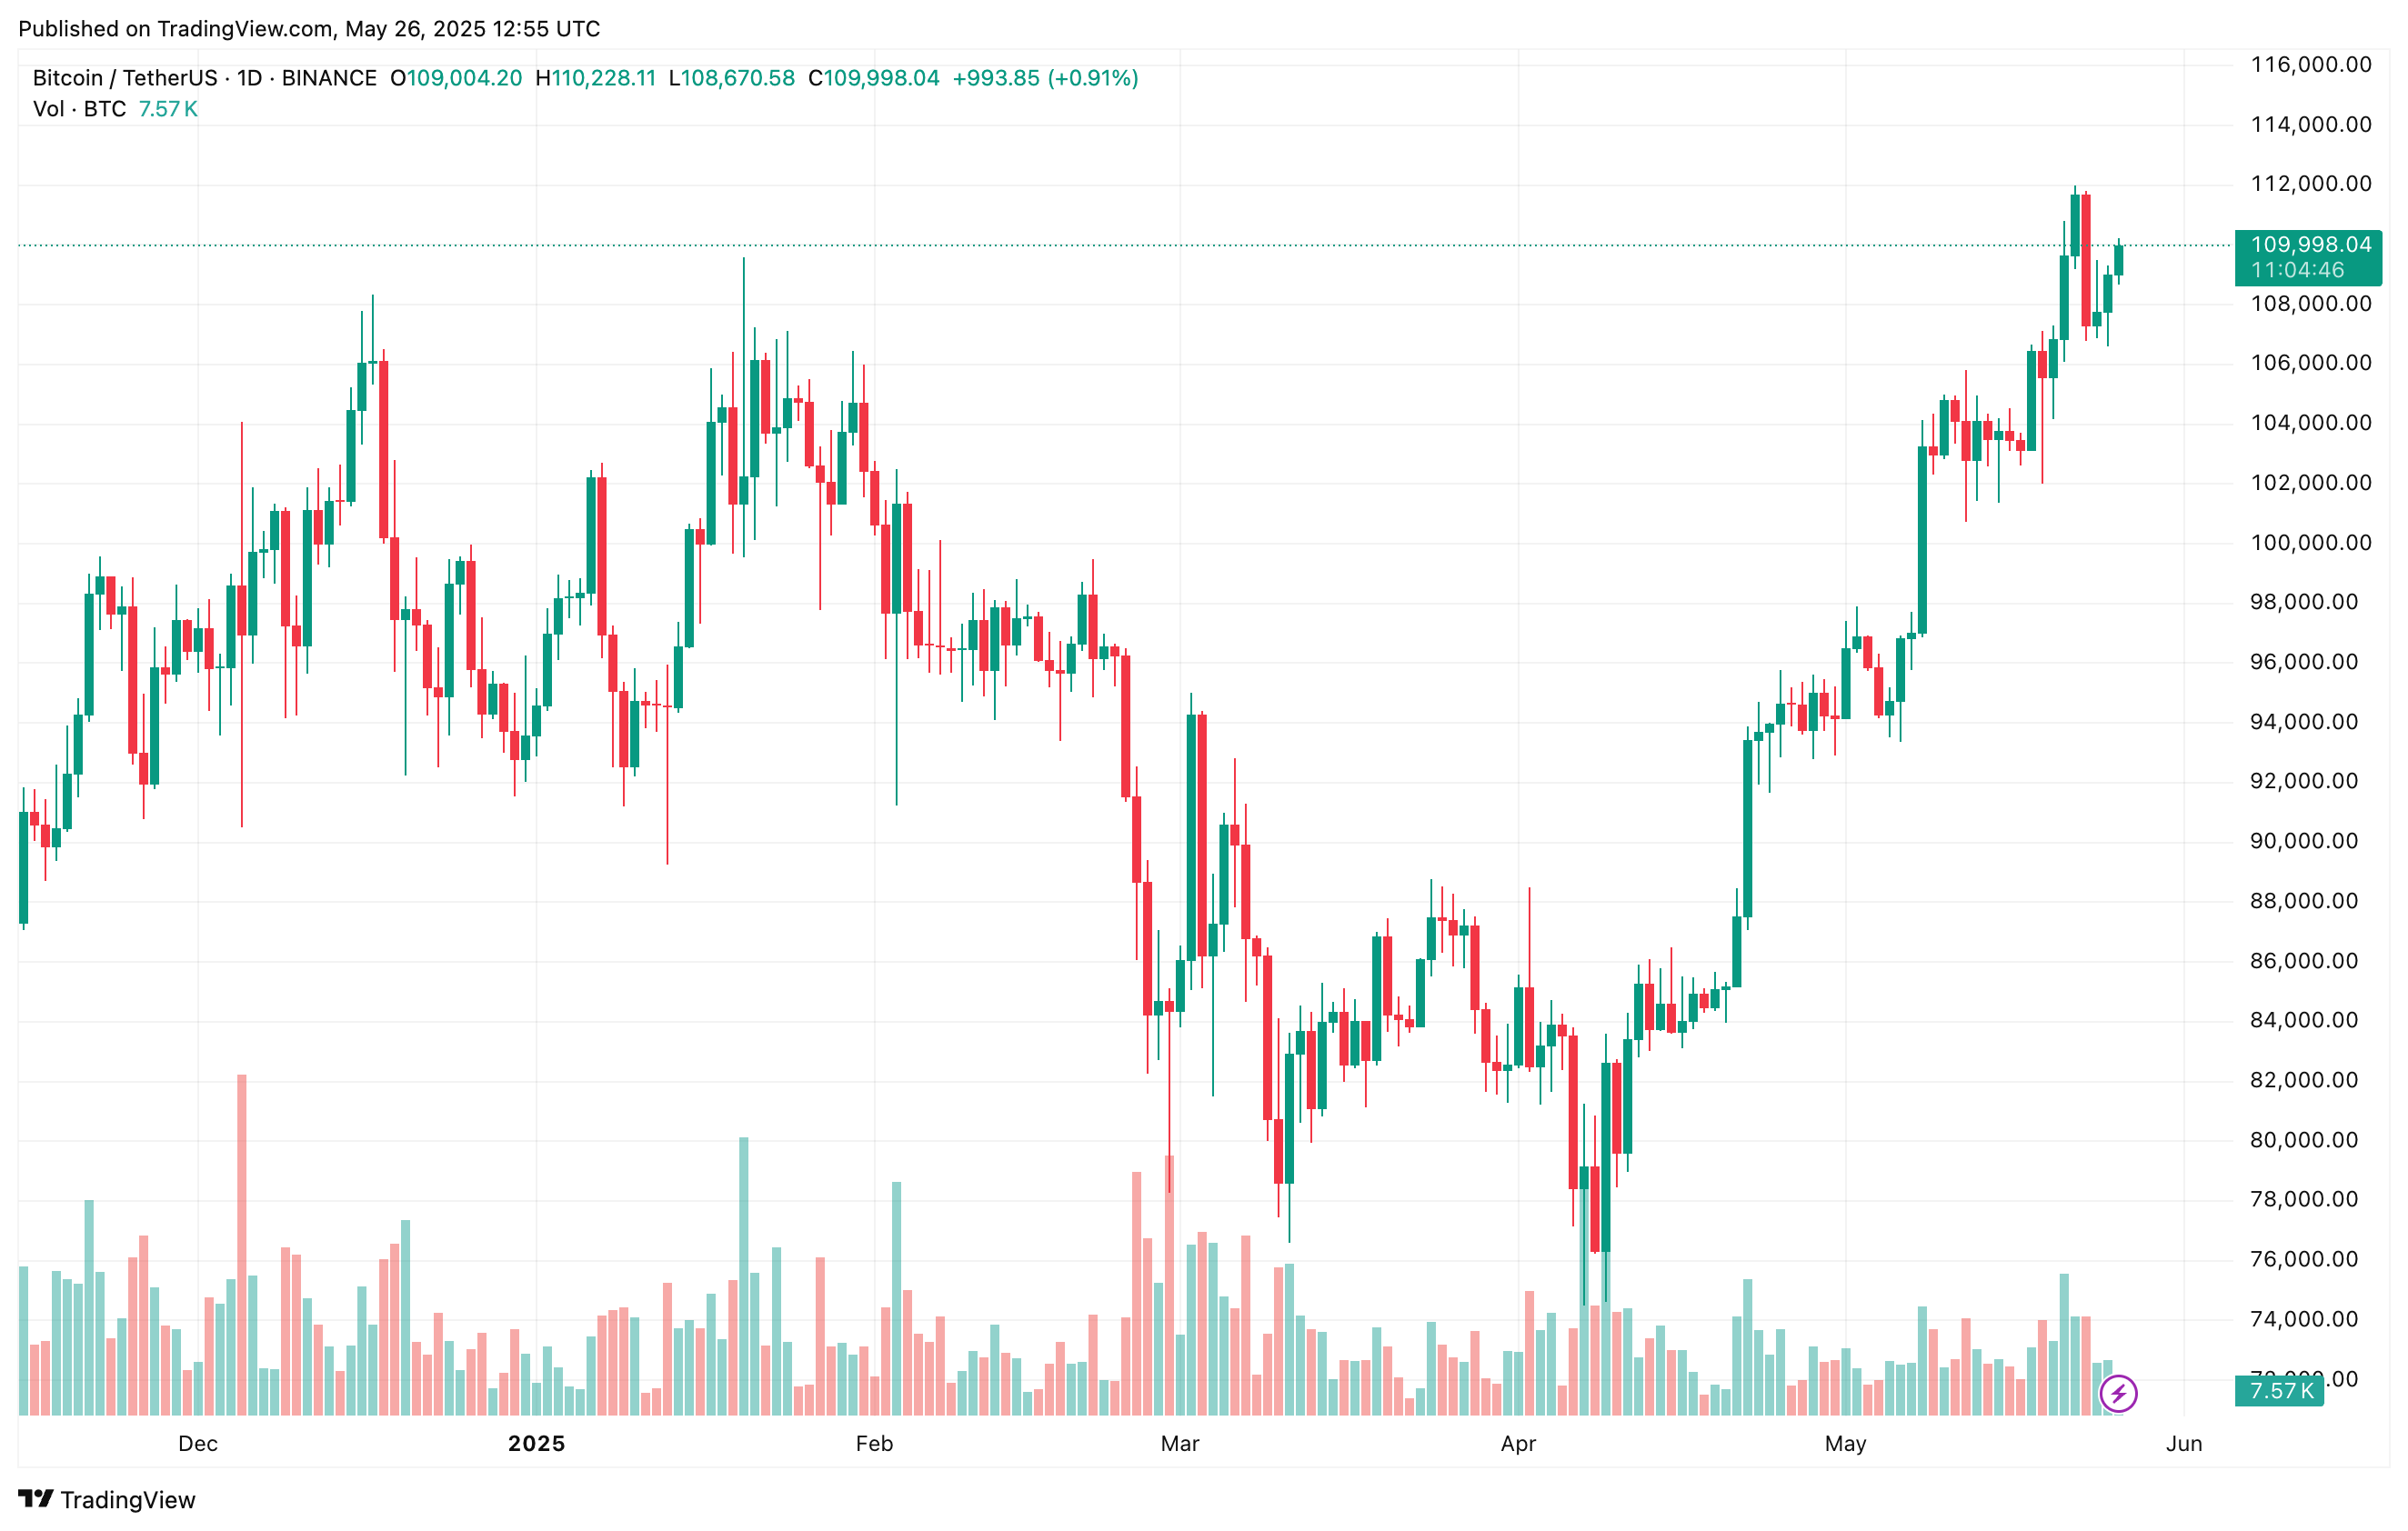
Following a rough first quarter in 2025, Bitcoin has shown significant recovery, surging from a local bottom of $74,508 on April 6 to nearly $110,000. This recent rally has revived bullish sentiment across the market.
Fueling the optimism are strong inflows into spot Bitcoin exchange-traded funds (ETFs), indicating renewed institutional interest. Meanwhile, Bitcoin’s open interest recently hit a fresh all-time high, reinforcing expectations of continued price momentum.
However, not all indicators are aligned. Bitcoin whales – large holders of BTC – have shown mixed behavior, with some accumulating while others appear to be taking profits. At press time, BTC trades at $109,998, up 2.2% in the past 24 hours.


Read More

Bitcoin gets a green light from a reliable momentum gauge. Here are key levels to watch