Bitcoin Price Analysis: BTC Faces $120K Resistance as Compression Tightens

Share:
Predictions Markets
See what traders are focused on

Bitcoin is currently hovering around $119,060 after consolidating below the $120,000 resistance mark. The broader structure remains bullish, with the Bitcoin price today still trading well above its long-term EMAs. However, momentum has cooled, and multiple indicators suggest a make-or-break moment as BTC coils inside a tightening pattern.
What’s Happening With Bitcoin’s Price?
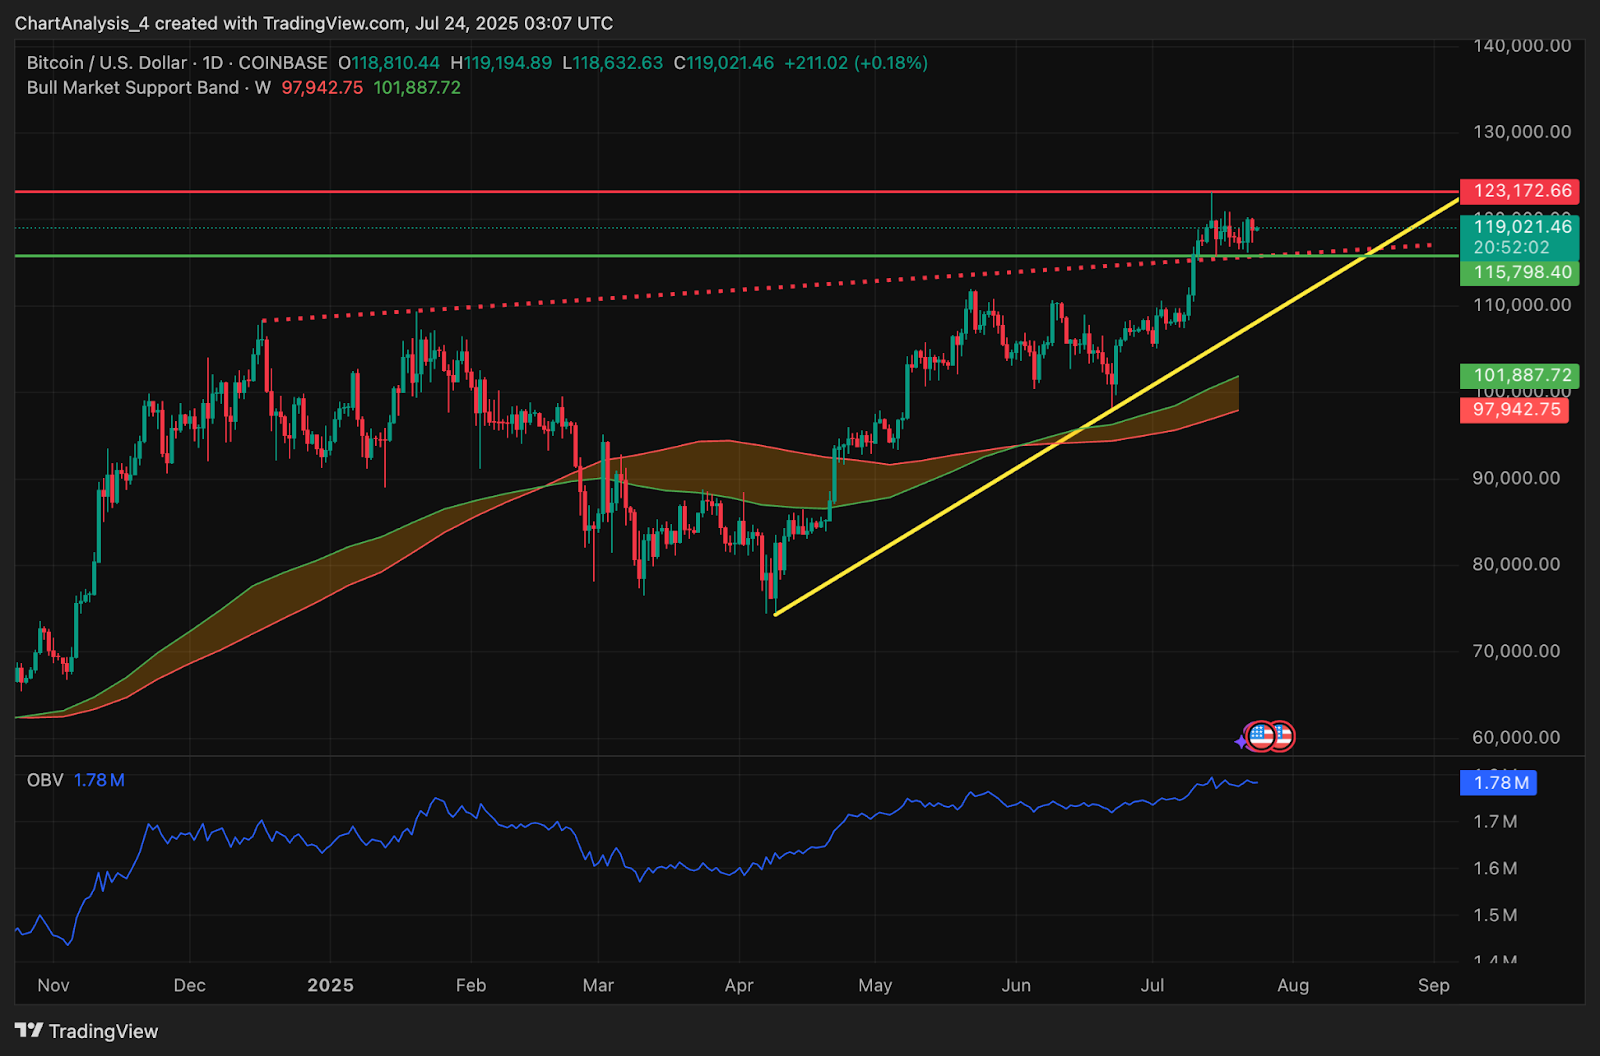
The daily chart shows BTC has respected the ascending trendline that started in early May, while repeatedly testing overhead resistance near $123,000. Price has now stalled under this zone, forming a flat structure that intersects with dynamic trendline support. The On-Balance Volume (OBV) has been stable, implying accumulation is ongoing even as volatility narrows.
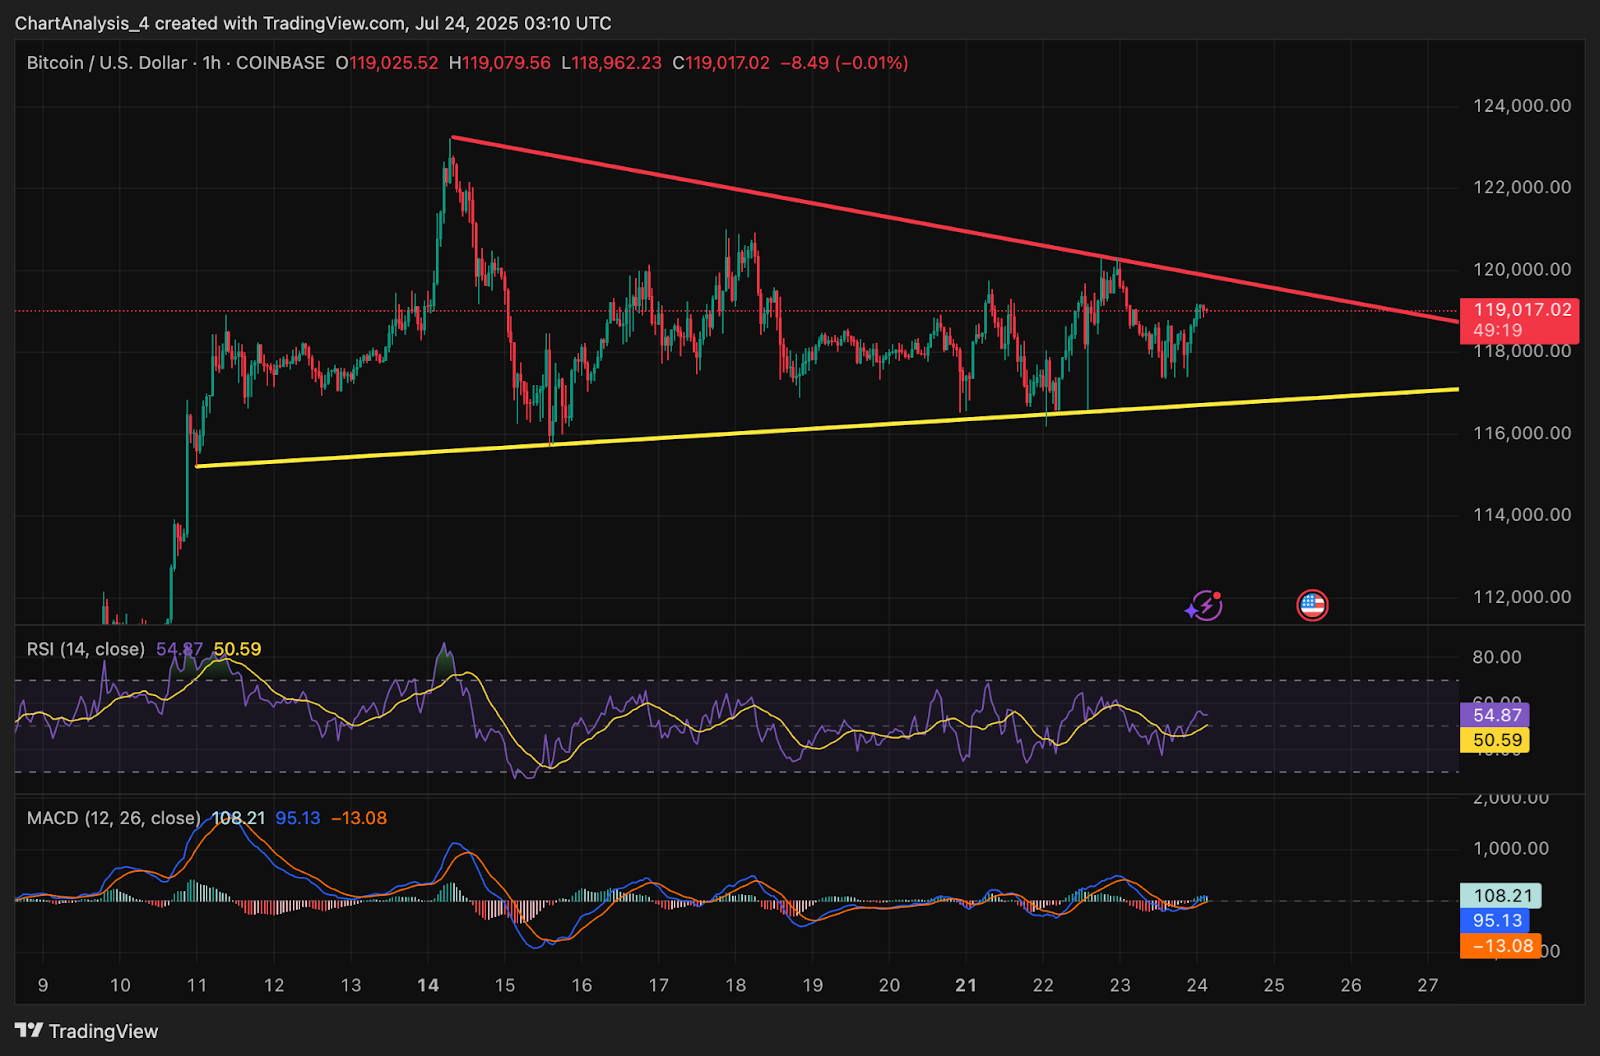
Meanwhile, the 1-hour chart highlights a symmetrical triangle pattern forming since mid-July. Price is being squeezed between descending resistance and rising support lines, with Bitcoin price locked between $118,000 and $120,000. This structure suggests a breakout or breakdown may be imminent.
Why Is Bitcoin Price Going Down Today?
The post Bitcoin Price Analysis: BTC Faces $120K Resistance as Compression Tightens appeared first on Coin Edition.


Read More

Bitcoin’s $64K rebound has three days before its next big challenge threatens to derail momentum
