Is ETH Primed to Take Down the $4K Resistance and Chart New All-Time High? (Ethereum Price Analysis)

Share:
Predictions Markets
See what traders are focused on

Ethereum’s price has been gaining bullish momentum recently after experiencing a correction in the last couple of months.
With the asset approaching its recent high, investors are hoping for new records, but breaking the $4,000 resistance seems tougher than expected.
Technical Analysis
By TradingRage
The Daily Chart
In the daily timeframe, the price blasted through the higher boundary of the large descending channel a while ago. The market has been consolidating since, but there is no sign of a deep correction.
With the $3,600 area turning into a support level, the market will likely break through the key $4,000 resistance zone. In this case, market participants can be optimistic that a mid-term rally toward the $4,800 all-time high might begin soon.
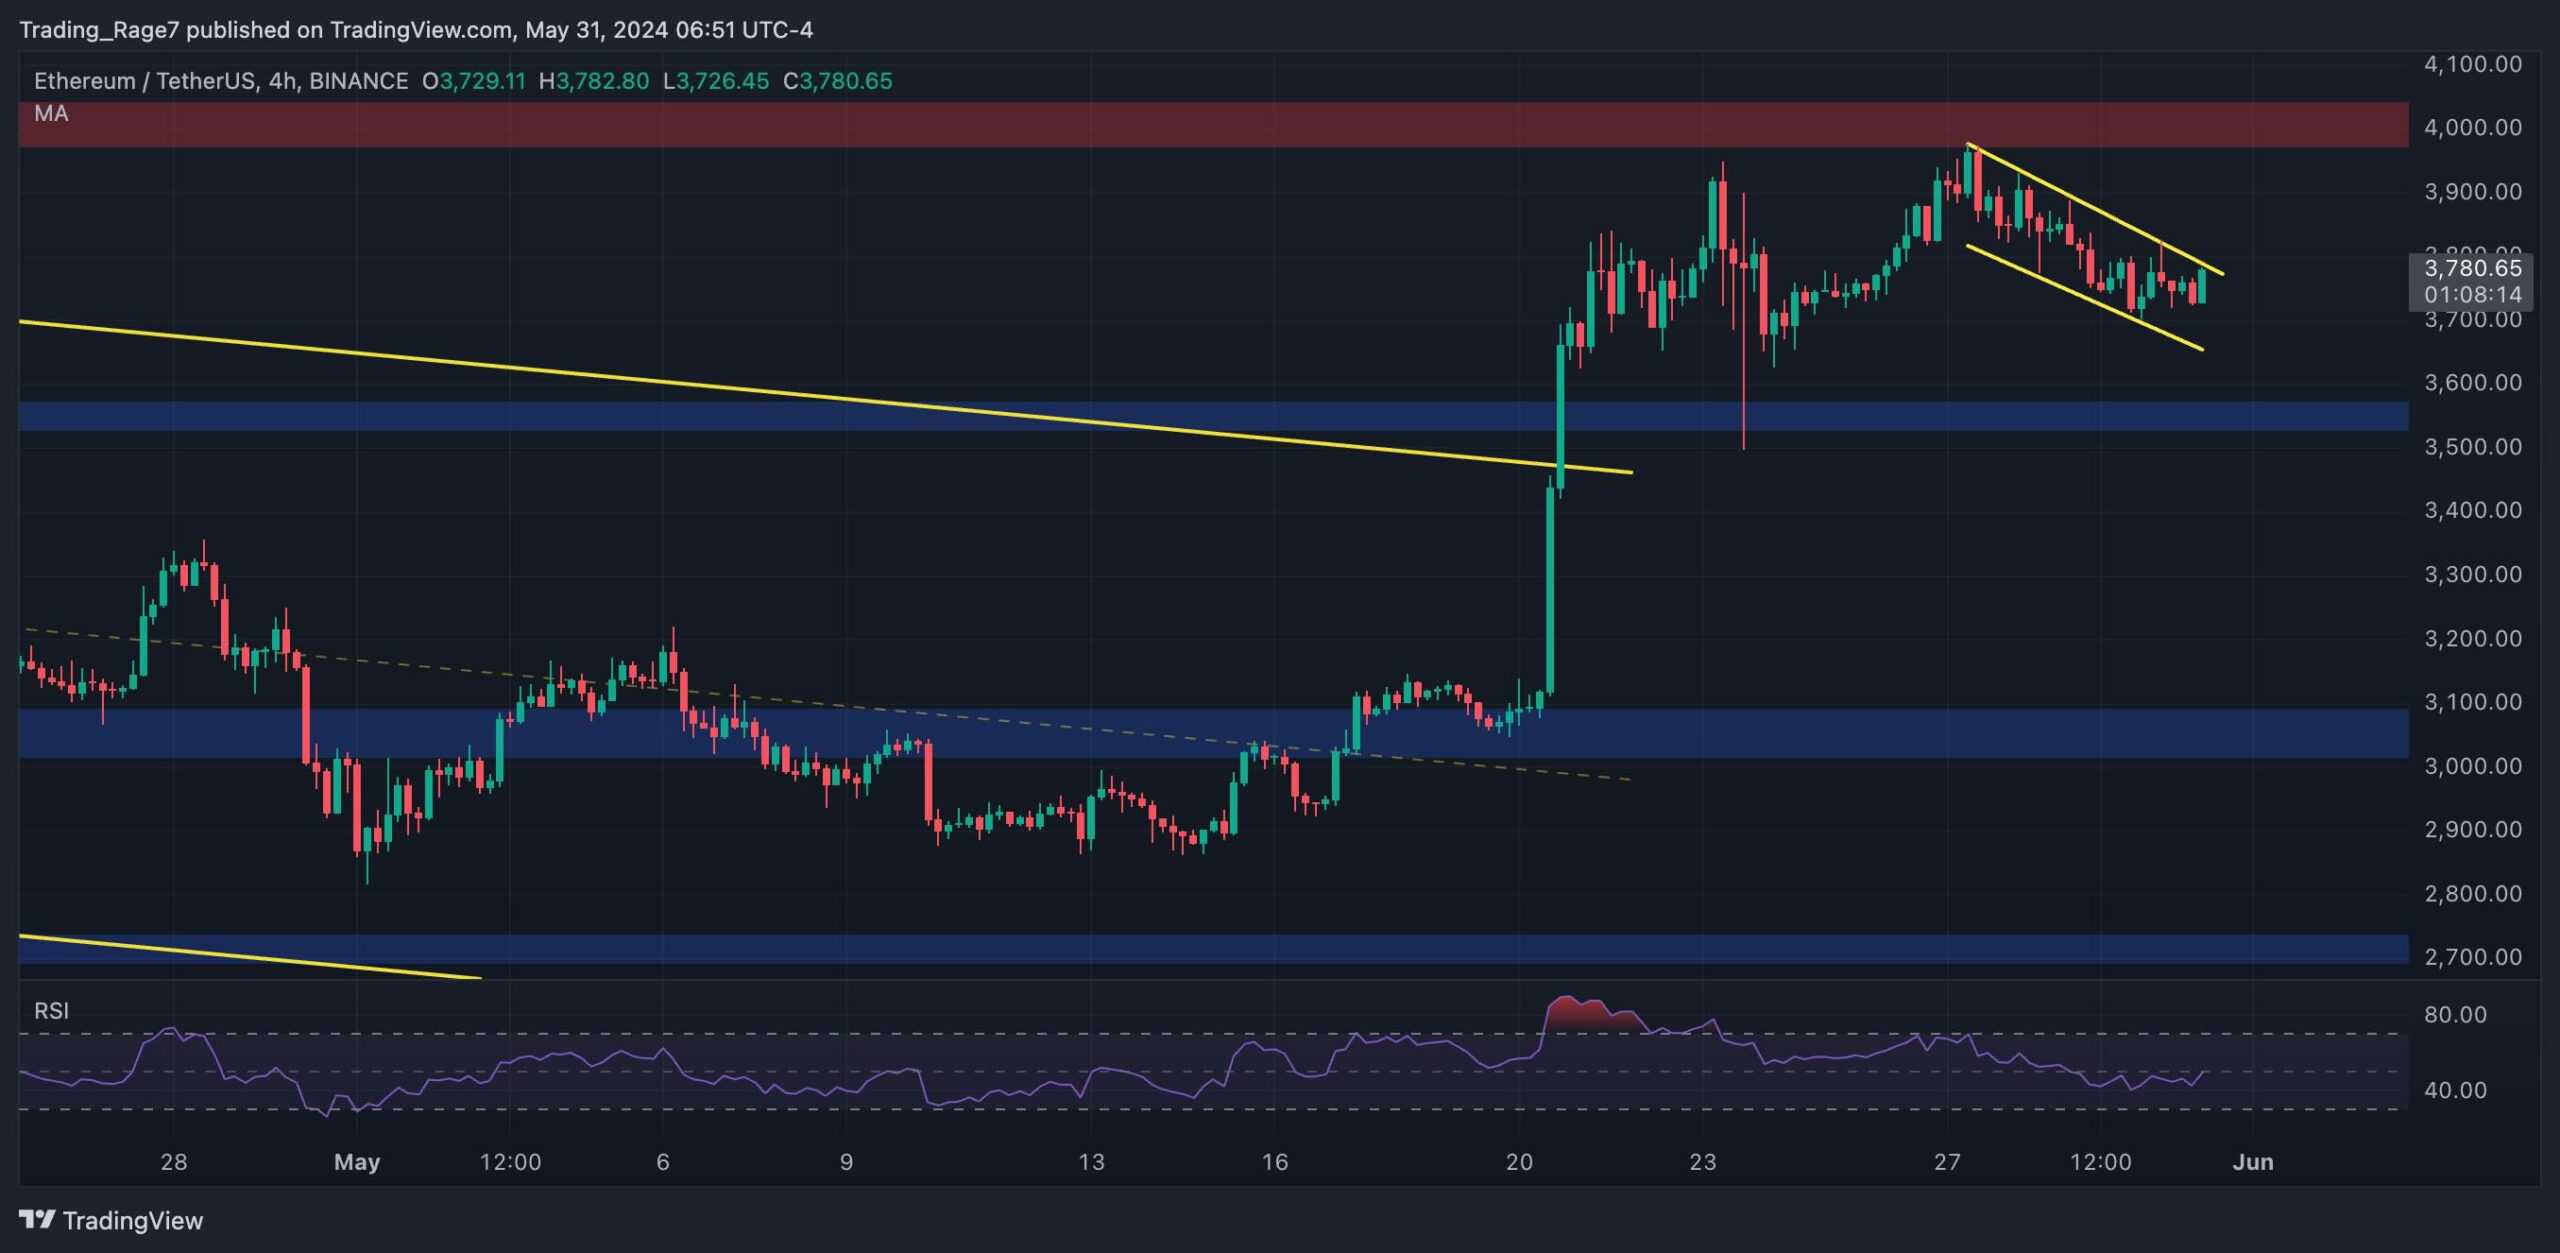
The 4-Hour Chart
The 4-hour chart is also demonstrating some bullish signs. The price has been declining inside a bullish flag pattern this week. However, it seemingly breaks the flag to the upside, a classic bullish continuation signal.
With the Relative Strength Index also on the verge of rising above 50%, the momentum is also shifting in favor of a bullish move. Therefore, if things do not change drastically, it could only be a matter of time before the price breaks above the $4,000 resistance level.
Sentiment Analysis
By Shayan
Open Interest
Ethereum’s price experienced a rapid impulsive surge last week, nearing the $4K mark. This uptrend has sparked renewed demand and heightened buyer activity as traders chase substantial profits.
The accompanying chart highlights Ethereum’s open interest, a crucial metric for gauging futures market sentiment. Generally, higher open interest values are associated with bullish sentiment, while extremely high values can lead to increased volatility and potential liquidation cascades.
The chart reveals a steep rise in open interest alongside the recent bullish run. While this surge in open interest typically signals strong bullish sentiment, it also introduces potential volatility and the risk of sudden, unexpected price movements in either direction. Given the high open interest values and the inherent risks of heightened volatility, it is advisable for investors to manage their risk carefully in the short term.
The post Is ETH Primed to Take Down the $4K Resistance and Chart New All-Time High? (Ethereum Price Analysis) appeared first on CryptoPotato.
In This News
Coins

$ 1.78K
-5.16%
$ 0.00273
-9.29%
$ 0.00...361

$ 0.000207

$ 0.001


Predictions Markets
See what traders are focused on
Share:
In This News
Coins
$ 1.78K
-5.16%$ 0.00273
-9.29%$ 0.00...361
$ 0.000207
$ 0.001
Predictions Markets
See what traders are focused on
Share:
Read More

Ethereum Crashing to 14-Month Low Is a ‘Screaming Buy-The-Dip Opportunity’ – Analyst
