Bitcoin Pushes Past $88K Amid Rising Volatility and On-Chain Resistance Zones

Share:
Predictions Markets
See what traders are focused on

Bitcoin has maintained its upward momentum since the week started, signaling renewed interest and optimism in the market. The asset reclaimed the $88,000 price level on Monday and continues to trade above this zone, marking a nearly 10% rise in value over the past seven days.
The steady price recovery comes after weeks of retracement, during which Bitcoin experienced considerable selling pressure and fell from previous highs.
On-Chain Resistance Zones Identified
IntoTheBlock, an on-chain analytics platform, provided insights on whether Bitcoin could be on track to retest its all-time high. The firm highlighted several key resistance ranges that may impact Bitcoin’s price action in the near term.
These include the $88,355.91 to $90,920.05, $90,920.05 to $93,591.02, $93,591.02 to $96,262.00, $96,262.00 to $98,932.97, and $98,932.97 to $101,603.95 levels—zones where many addresses are currently holding Bitcoin at a loss.
Is Bitcoin on its way to test its highs?
The red bubbles in this chart highlight levels where underwater investors could sell as they break even, especially if uncertainty persists.
A key zone is around $97.4k, where roughly 1.44 million BTC are currently holding at a loss. pic.twitter.com/LKaDBen7cU
— IntoTheBlock (@intotheblock) March 24, 2025
Notably, around the $97.4K level alone, approximately 1.44 million BTC are held by investors in unrealized loss positions, which could introduce selling pressure as prices recover.
Despite the resistance ahead, other on-chain activity shows signs of investor confidence. According to IntoTheBlock, Bitcoin saw over $220 million in net outflows from centralized exchanges in the past 24 hours.
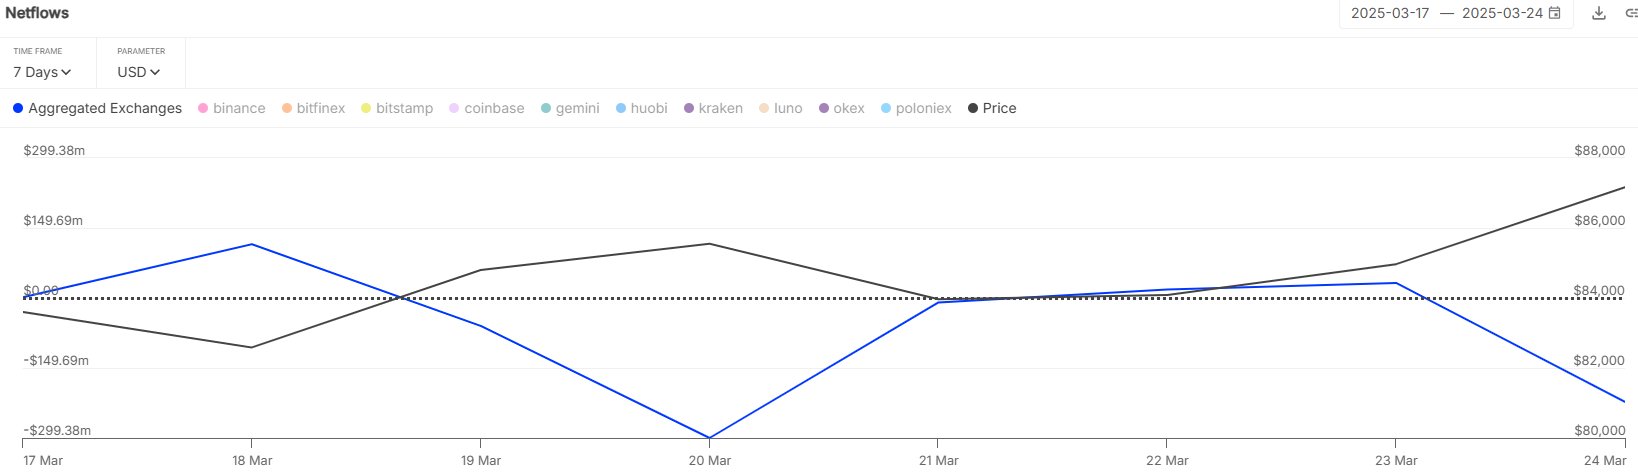
Over the past week, total outflows have exceeded $424 million, often interpreted as a sign of investors moving assets into cold storage rather than preparing to sell.
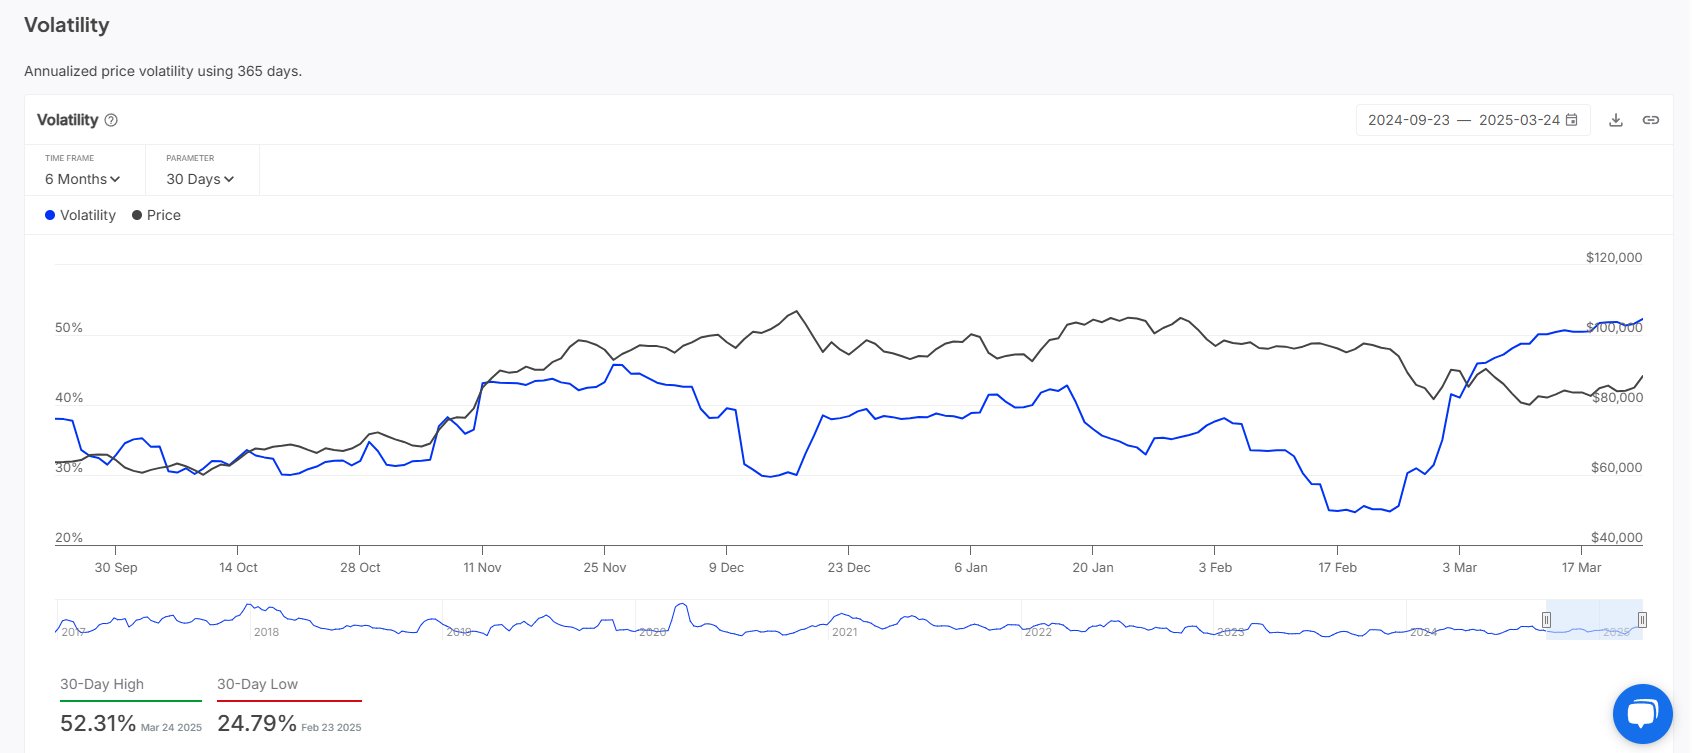
Meanwhile, crypto analyst Burak Kesmeci noted that Bitcoin’s 30-day volatility index has surged to 52.31 points—its highest level in the past six months. The spike in volatility coincides with anticipation around the US Core PCE report expected Friday, a macroeconomic event that could introduce further price swings.
Technical Outlook On Bitcoin
From a technical perspective, analysts remain divided. Crypto analyst Ali pointed out that Bitcoin is approaching a key resistance zone around $89,000, where the 50-day moving average intersects with a descending trendline drawn from the January all-time high.
The outcome at this level may influence the direction of the next major move. On the other hand, analyst Javon Marks highlighted what he described as a potential breakout pattern forming on Bitcoin’s chart.
BREAKOUT ALERT on Bitcoin and the last breakout after similar action led into one of the most powerful and FASTEST bullish moves so far this entire cycle!$BTC can be ready to deliver another powerful and speedy run to new All Time Highs… https://t.co/tchC9wsLFl pic.twitter.com/QKbDAUV88l
— JAVON
MARKS (@JavonTM1) March 25, 2025
He pointed to a previous breakout that triggered one of the fastest rallies in the current cycle and noted similar technical behavior emerging again. Marks believes that if momentum continues, Bitcoin could be positioning itself for another rapid climb toward new record highs.
Featured image created with DALL-E, Chart from TradingView


Read More

Standard Chartered Maintains $100,000 Bitcoin Forecast for End of 2026