BTC/USDT Spot CVD Chart Analysis: Volume Heatmap and Order Flow Insights for July 1
Share:
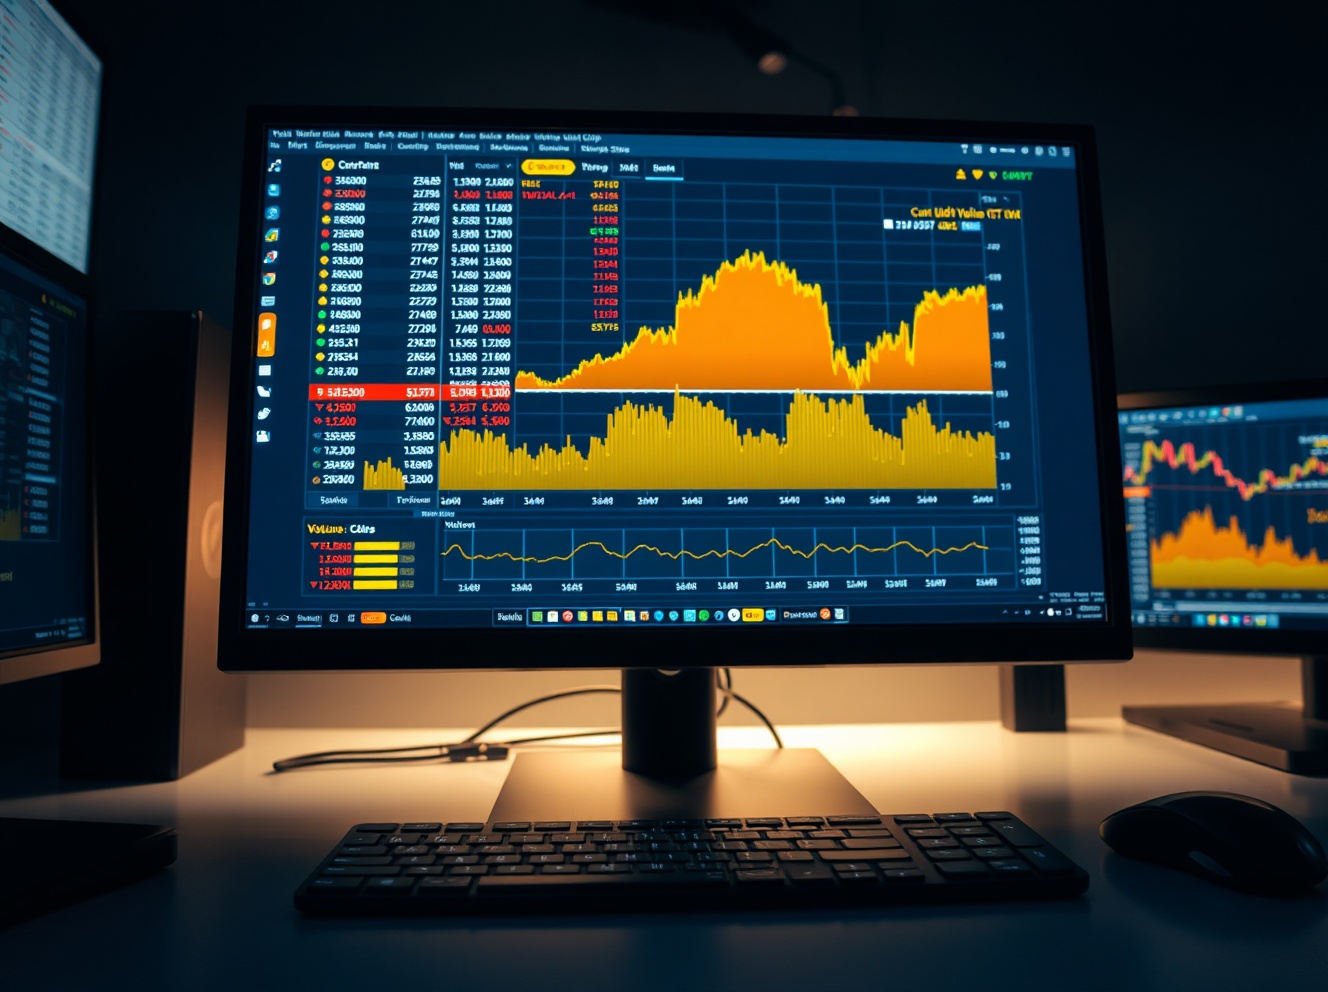
On July 1, 2025 the BTC/USDT Spot Cumulative Volume Delta (CVD) chart and Volume Heatmap map buying and selling pressure by price level, with the yellow CVD line tracking $100–$1,000 trades (retail) and the brown line tracking $1,000,000–$10,000,000 trades (institutional). Traders can use divergences between retail and institutional CVD and heatmap volume to identify support and resistance, assess whether rallies are backed by large institutional buying or thin liquidity, and refine risk management for crypto spot trading, DeFi and DEX strategies.
Predictions Markets
See what traders are focused on

BitcoinWorld
BTC/USDT Spot CVD Chart Analysis: Volume Heatmap and Order Flow Insights for July 1
On July 1, 2025, the Spot Cumulative Volume Delta (CVD) chart for the BTC/USDT trading pair offers a detailed view of market microstructure, tracking the balance between buying and selling pressure at specific price levels. The analysis combines a Volume Heatmap in the upper section with CVD data below, providing traders with a granular understanding of order flow dynamics.
Understanding the Volume Heatmap
The Volume Heatmap tracks the scale of trading activity at various price points. When the price remains within a narrow range for an extended period or experiences significant movement, the background color becomes brighter. These brighter zones often indicate areas where a large number of transactions have occurred, potentially forming future support or resistance levels. For the BTC/USDT pair on July 1, the heatmap highlights key price clusters that may influence short-term price action.
CVD Indicator: Buy and Sell Order Flow
The Cumulative Volume Delta indicator categorizes buy and sell orders by trade size, offering a clear signal of institutional versus retail activity. As buy orders increase, the corresponding colored line on the chart rises. The yellow line represents orders between $100 and $1,000, typically associated with retail traders. In contrast, the brown line tracks large orders ranging from $1 million to $10 million, often linked to institutional participants. Divergences between these lines can provide early signals of shifts in market sentiment.
Implications for Traders
Monitoring the CVD alongside the Volume Heatmap allows traders to assess whether price movements are supported by genuine volume or driven by thin order books. For instance, a price rally accompanied by rising CVD for large orders suggests strong institutional buying, increasing the likelihood of sustained momentum. Conversely, if the heatmap shows high volume at a resistance level while CVD for large orders declines, it may indicate distribution and a potential reversal.
Conclusion
The July 1 Spot CVD chart for BTC/USDT provides actionable data for traders focusing on order flow and volume analysis. By interpreting the Volume Heatmap and CVD lines together, market participants can better identify key support and resistance zones and gauge the strength of buying or selling pressure. This approach prioritizes data-driven decision-making over speculation, aligning with sound risk management practices.
FAQs
Q1: What does the Spot CVD chart show for BTC/USDT?
The chart displays the Cumulative Volume Delta, which measures the net difference between buying and selling volume, along with a Volume Heatmap that highlights price levels with high trading activity.
Q2: How can traders use the Volume Heatmap?
The heatmap helps identify potential support and resistance zones by showing where significant volume has accumulated, often acting as areas of price consolidation or reversal.
Q3: What is the difference between the yellow and brown lines in the CVD chart?
The yellow line tracks orders between $100 and $1,000, typically representing retail trading activity. The brown line tracks orders between $1 million and $10 million, reflecting institutional order flow.
This post BTC/USDT Spot CVD Chart Analysis: Volume Heatmap and Order Flow Insights for July 1 first appeared on BitcoinWorld.


Read More

Bitcoin gets a green light from a reliable momentum gauge. Here are key levels to watch