Bitcoin OG Owen Gunden Deposits Final 2,499 BTC ($228M) to Kraken – Details

Share:
Predictions Markets
See what traders are focused on

Bitcoin is currently trading below $92,000, and the market is showing clear signs of exhaustion as selling pressure intensifies. Fear has pushed sentiment toward the bearish end of the spectrum, with many analysts now arguing that BTC may be entering a new bear market. The loss of key support levels and the rapid acceleration of downside volatility have only fueled these concerns, especially as short-term holders continue to capitulate at scale.
However, not all perspectives are bearish. Some analysts believe that Bitcoin may be forming a local bottom, as the current correction resembles previous mid-cycle retracements seen during strong bull markets. They argue that the broader macro environment remains supportive and that long-term holders have not shown signs of structural weakness. As selling pressure concentrates among weak hands, the possibility of a reversal increases — especially once forced sellers exhaust themselves.
Adding to the uncertainty, new on-chain data from Lookonchain revealed that Bitcoin OG Owen Gunden just deposited all his remaining 2,499 BTC into Kraken roughly an hour ago. Moves like this often trigger speculation, as exchange deposits from early holders can signal potential selling. Yet historically, similar events have also occurred near cycle bottoms when panic is at its peak.
A Massive BTC Transfer Sparks Market Speculation
According to fresh data from Lookonchain, Bitcoin OG Owen Gunden has just deposited his remaining 2,499 BTC (worth $228 million) into Kraken roughly an hour ago. This move has immediately raised questions across the market, as large exchange deposits from early whales often signal potential selling pressure.
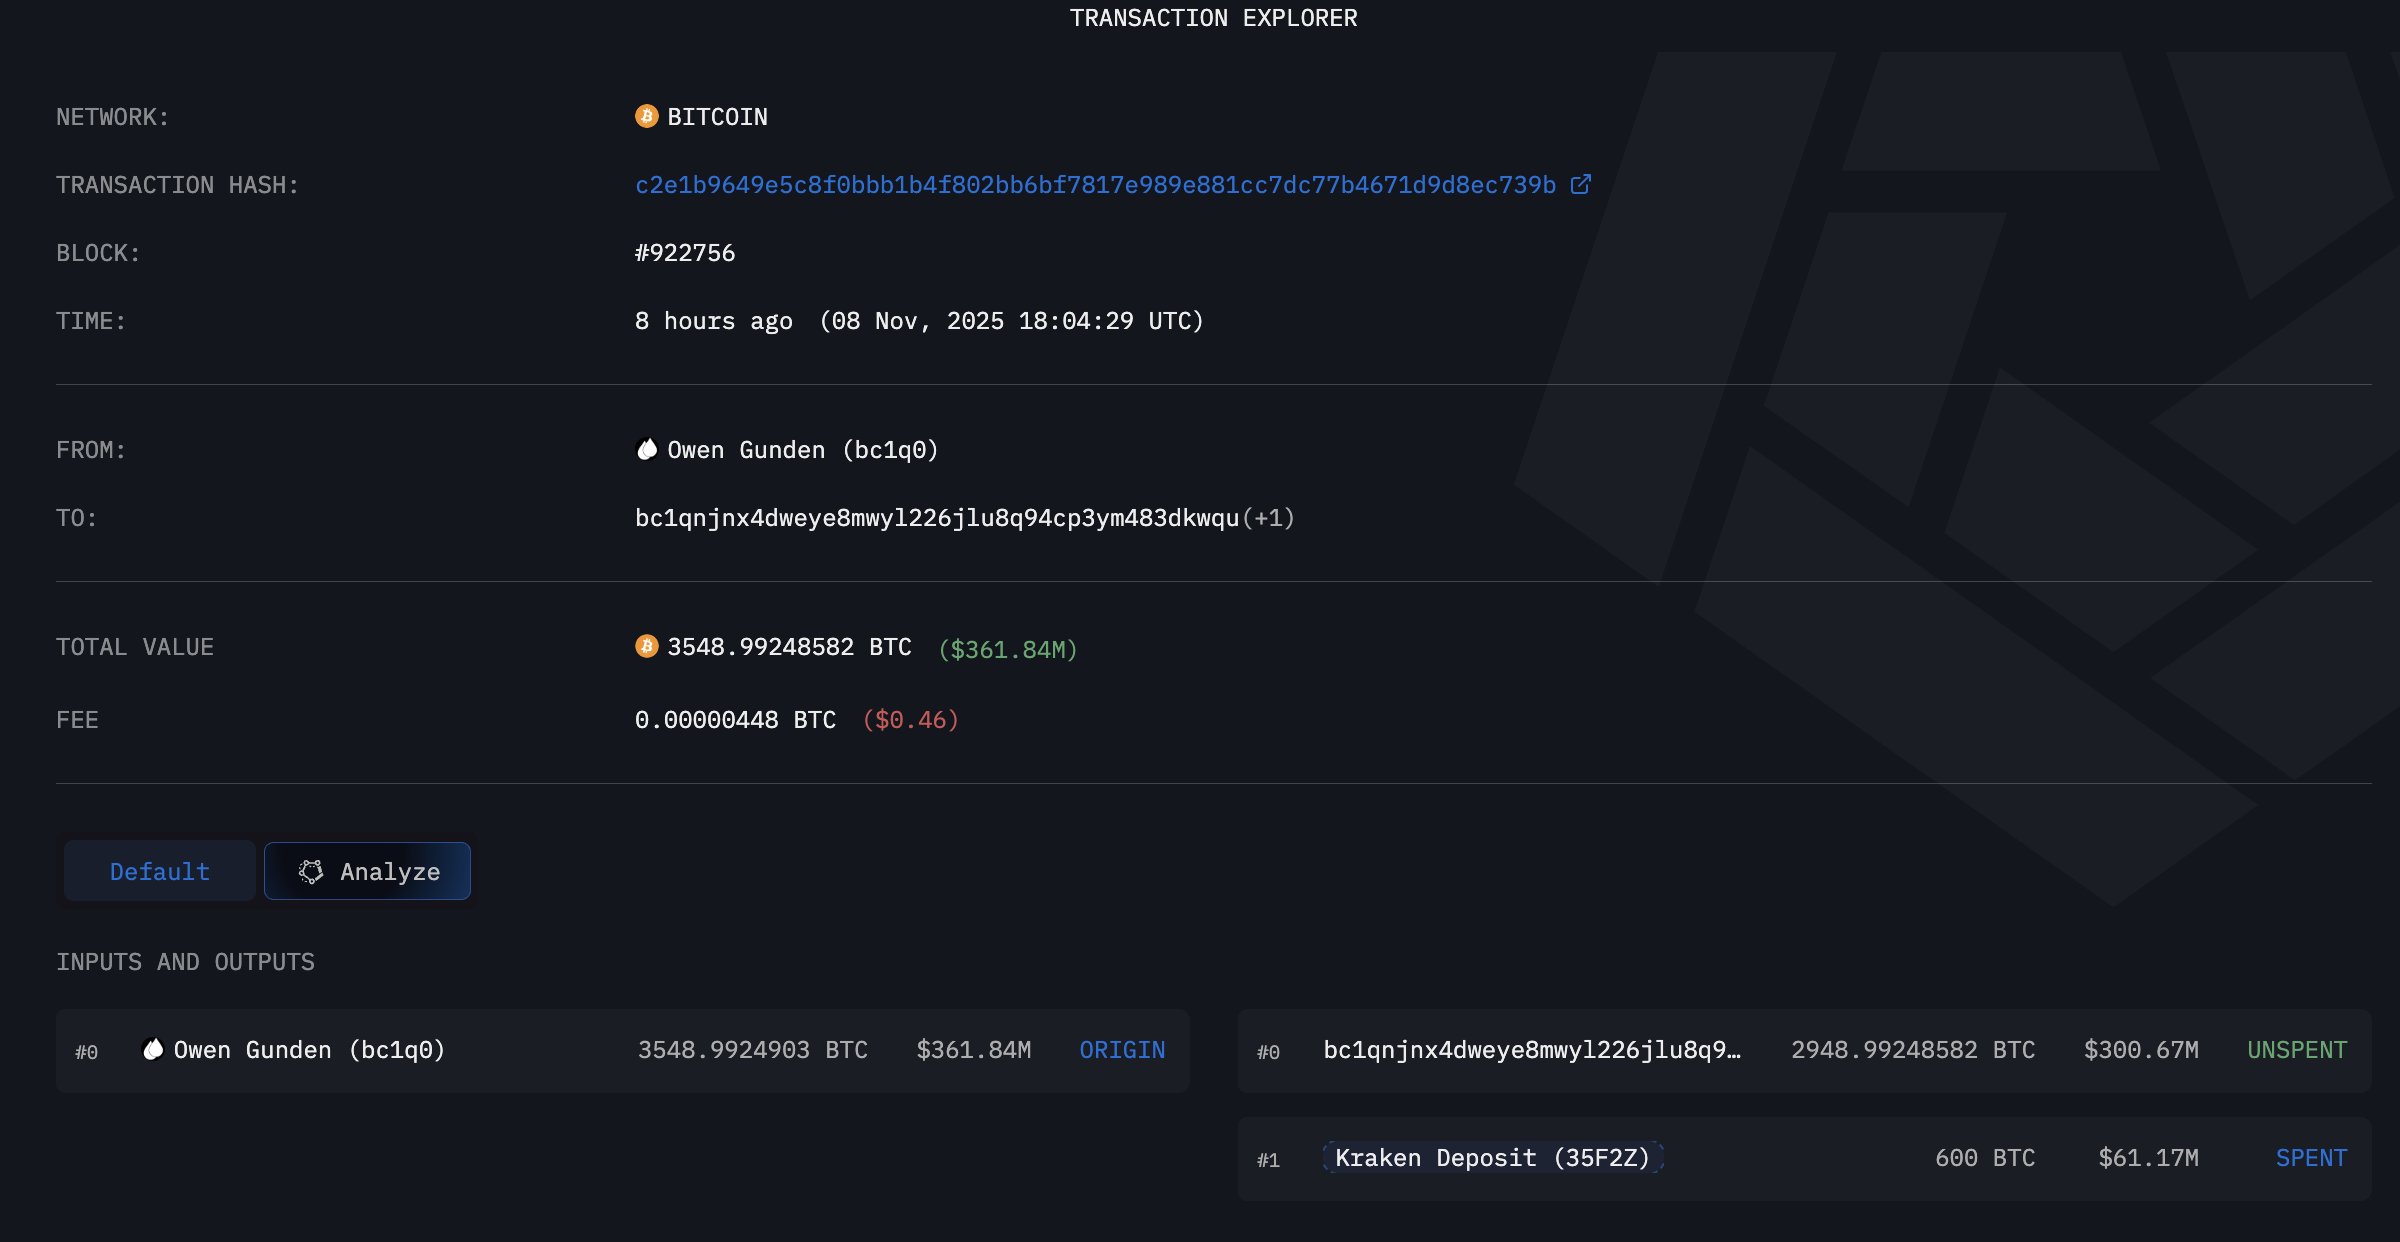
What makes this development even more notable is the context: just two weeks ago, Lookonchain reported that Gunden appeared ready to offload his entire 11,000 BTC stash — a position worth over $1.12 billion at the time. Now, with this final deposit, it appears he has officially completed the move.
For many traders, this confirms that one of the oldest and largest long-term holders has fully exited or is preparing to exit the market. Such whale behavior can amplify fear during corrective phases, especially as Bitcoin continues to struggle below $92K. Moves of this scale not only contribute to short-term volatility but also influence sentiment by signaling that even early accumulators may be reducing exposure.
However, historically, capitulation events from long-term holders have often coincided with or preceded major turning points. If this massive transfer marks the end of Gunden’s sell-off, the market may soon absorb the pressure — potentially clearing the path for a recovery once the fear subsides.
Short-Term Trend Still Under Pressure
Bitcoin’s 4-hour chart reveals a market that remains firmly under short-term selling pressure, despite occasional relief bounces. The price is struggling to reclaim $92,000, a level that previously acted as support but is now working as resistance. The series of lower highs and lower lows highlights a persistent downtrend that has shaped BTC’s trajectory since early October.

All major moving averages—the 50 SMA, 100 SMA, and 200 SMA—are positioned above current price action and pointing downward. This alignment confirms a clear short-term bearish structure. Each time BTC attempts to recover, it meets strong resistance at these declining MAs, signaling that sellers remain in control. The most recent bounce barely reached the 50 SMA before being rejected again, reinforcing the weakness of buyer momentum.
Volume remains elevated on downswings, which indicates that sell-offs continue to be driven by conviction rather than random volatility. Buyers are stepping in around the $89,000–$91,000 zone, but so far, this support has only produced temporary pauses rather than meaningful reversals.
For a structural shift, BTC would need to reclaim at least the $95,000 area and break above the 100 SMA. Until then, the trend remains tilted toward further downside or continued consolidation near current levels.
Featured image from ChatGPT, chart from TradingView.com


Read More

Bitcoin exchange flows fall 91% as Binance leaves EU under MiCA rules