Ethereum On-Chain Demand Should Sustain ETH Above $4,000, IntoTheBlock Says

Share:
Predictions Markets
See what traders are focused on

The market intelligence platform IntoTheBlock has revealed how Ethereum has built up strong on-chain demand zones that should keep it afloat above $4,000.
Ethereum Has Two Major Support Centers Just Below Current Price
In a new post on X, IntoTheBlock has discussed about how the on-chain demand zones for Ethereum are looking right now. Below is the chart shared by the analytics firm that shows the amount of supply that the investors bought at the price ranges near the current spot ETH value.
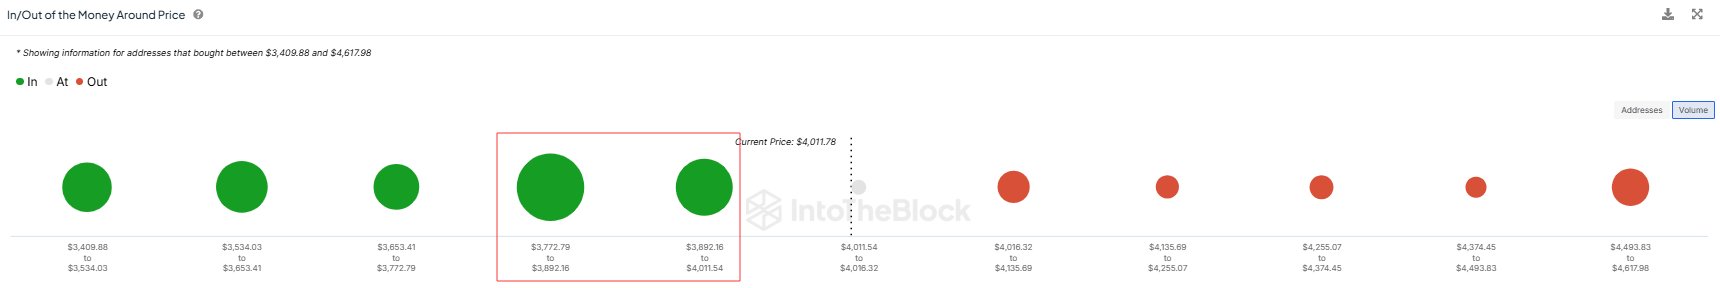
As is visible in the graph, the Ethereum price ranges up ahead have only small dots associated to them, meaning not much of the supply was last purchased at those levels.
It’s different for the price ranges below, however, with the $3,772 to $3,892 and $3,892 to $4,011 ranges in particular hosting the cost basis of a significant amount of addresses. In total, the investors purchased 7.2 million ETH (worth almost $28.4 billion at the current exchange rate) at these levels.
Demand zones are considered important in on-chain analysis due to how investor psychology tends to work out. For any holder, their cost basis is an important level, so they can be more likely to make a move when a retest of it occurs.
When this retest occurs from above (that is, the investor was in profit prior to it), the holder might decide to purchase more, thinking that the level would be profitable again in the near future. Similarly, investors who were in loss just before the retest might fear another decline, so they may sell at their break-even.
Naturally, these effects don’t matter for the market when only a few investors participate in the buying and selling, but visible fluctuations can appear when a large amount of holders are involved.
The aforementioned price ranges satisfy this condition, so it’s possible that Ethereum retesting them would produce a sizeable buying reaction in the market, which would end up providing support to the cryptocurrency.
During the past day, Ethereum has seen a slight dip into this region, so it now remains to be seen whether the high demand can push back the coin above $4,000 or not.
In some other news, the Ethereum Exchange Netflow has been negative since the beginning of this month, as IntoTheBlock has pointed out in another X post.
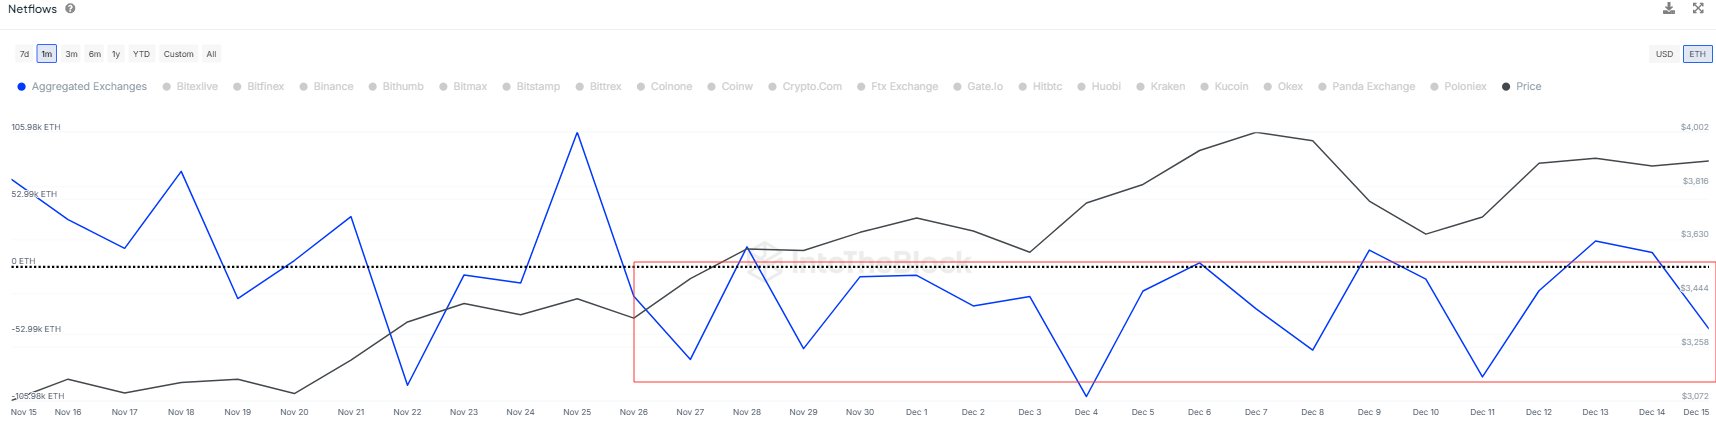
The Exchange Netflow is an on-chain indicator that keeps track of the net amount of Ethereum that’s flowing into or out of the wallets associated with centralized exchanges. “Over 400k ETH have flowed out since December 1st, suggesting a trend of accumulation,” notes the analytics firm.
ETH Price
At the time of writing, Ethereum is trading around $3,950, up 10% over the last week.
In This News
Coins

$ 64.07K
+0.22%
$ 1.80K
+1.03%
$ 0.00724
+1.39%
$ 0.000369

$ 0.001


Predictions Markets
See what traders are focused on
Share:
In This News
Coins
$ 64.07K
+0.22%$ 1.80K
+1.03%$ 0.00724
+1.39%$ 0.000369
$ 0.001
Predictions Markets
See what traders are focused on
Share:
Read More

OKX, MetaMask and Matter Labs Back Internet Court to Settle AI Agent Disputes