SOL Price Surges To $115 – Why Solana Could Rally Another 10%

Share:
Predictions Markets
See what traders are focused on

Solana is gaining bullish momentum above $110. SOL price is surging, and the bulls could soon aim for a move above the $120 level.
- SOL price started a fresh increase from the $95.00 support against the US Dollar.
- The price is now trading above $105 and the 100 simple moving average (4 hours).
- There is a key bullish trend line forming with support at $109.20 on the 4-hour chart of the SOL/USD pair (data source from Kraken).
- The pair could continue to rally if it clears the $115 and $118 resistance levels.
Solana Price Starts Fresh Rally
Solana price formed a base above the $94.00 support zone and recently started a fresh increase. There was a decent increase above the $98 and $100 levels.
The price is up nearly 10% and there was a move above the $110 level, outperforming Bitcoin and Ethereum. The bulls pushed the price close to $115. A high is formed near $114.98 and the price is showing no signs of upside exhaustion.
It is holding gains above the 23.6% Fib retracement level of the recent wave from the $103.38 swing low to the $114.98 high. Solana is now trading above $110 and the 100 simple moving average (4 hours).
There is also a key bullish trend line forming with support at $109.20 on the 4-hour chart of the SOL/USD pair. The trend line is near the 50% Fib retracement level of the recent wave from the $103.38 swing low to the $114.98 high.
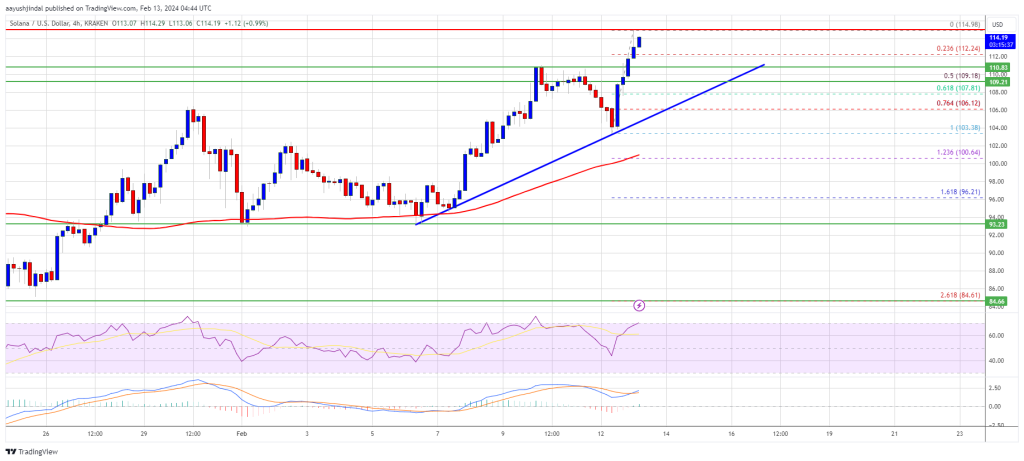
Source: SOLUSD on TradingView.com
Immediate resistance is near the $115 level. The next major resistance is near the $118 level. A successful close above the $118 resistance could set the pace for another major increase. The next key resistance is near $125. Any more gains might send the price toward the $132 level.
Are Dips Supported in SOL?
If SOL fails to rally above the $115 resistance, it could start a downside correction. Initial support on the downside is near the $112.20 level.
The first major support is near the $109.20 level and the trend line, below which the price could test $105. If there is a close below the $105 support, the price could decline toward the $100 support in the near term.
Technical Indicators
4-Hours MACD – The MACD for SOL/USD is gaining pace in the bullish zone.
4-Hours RSI (Relative Strength Index) – The RSI for SOL/USD is above the 50 level.
Major Support Levels – $102.20, and $109.20.
Major Resistance Levels – $115, $118, and $125.
In This News
Coins

$ 64.11K
+0.38%
$ 1.80K
+1.25%
$ 0.00...361

$ 0.00643

$ 0.000207


Predictions Markets
See what traders are focused on
Share:
In This News
Coins
$ 64.11K
+0.38%$ 1.80K
+1.25%$ 0.00...361
$ 0.00643
$ 0.000207
Predictions Markets
See what traders are focused on
Share:
Read More

Bitcoin, Solana, and Hyperliquid Show Promise for July Upside — Here’s Why