Why Has Bitcoin Been Bearish Lately? CryptoQuant Head Chimes In

Share:
Predictions Markets
See what traders are focused on

Bitcoin has continued its bearish momentum as its price has now slipped below $56,000. Here’s what could be behind this trajectory, according to CryptoQuant’s Head of Research.
Bitcoin On-Chain Metrics Are All Giving Bearish Signals Right Now
In a new thread on X, CryptoQuant Head of Research Julio Moreno has discussed why the original cryptocurrency has been struggling recently. “Bitcoin price is down simply because there is no demand growth,” notes the analyst.
To showcase how demand for the asset has been looking like, Moreno has shared the chart for the “Apparent Demand” indicator, which leverages on-chain data to estimate the 30-day demand for BTC among investors.
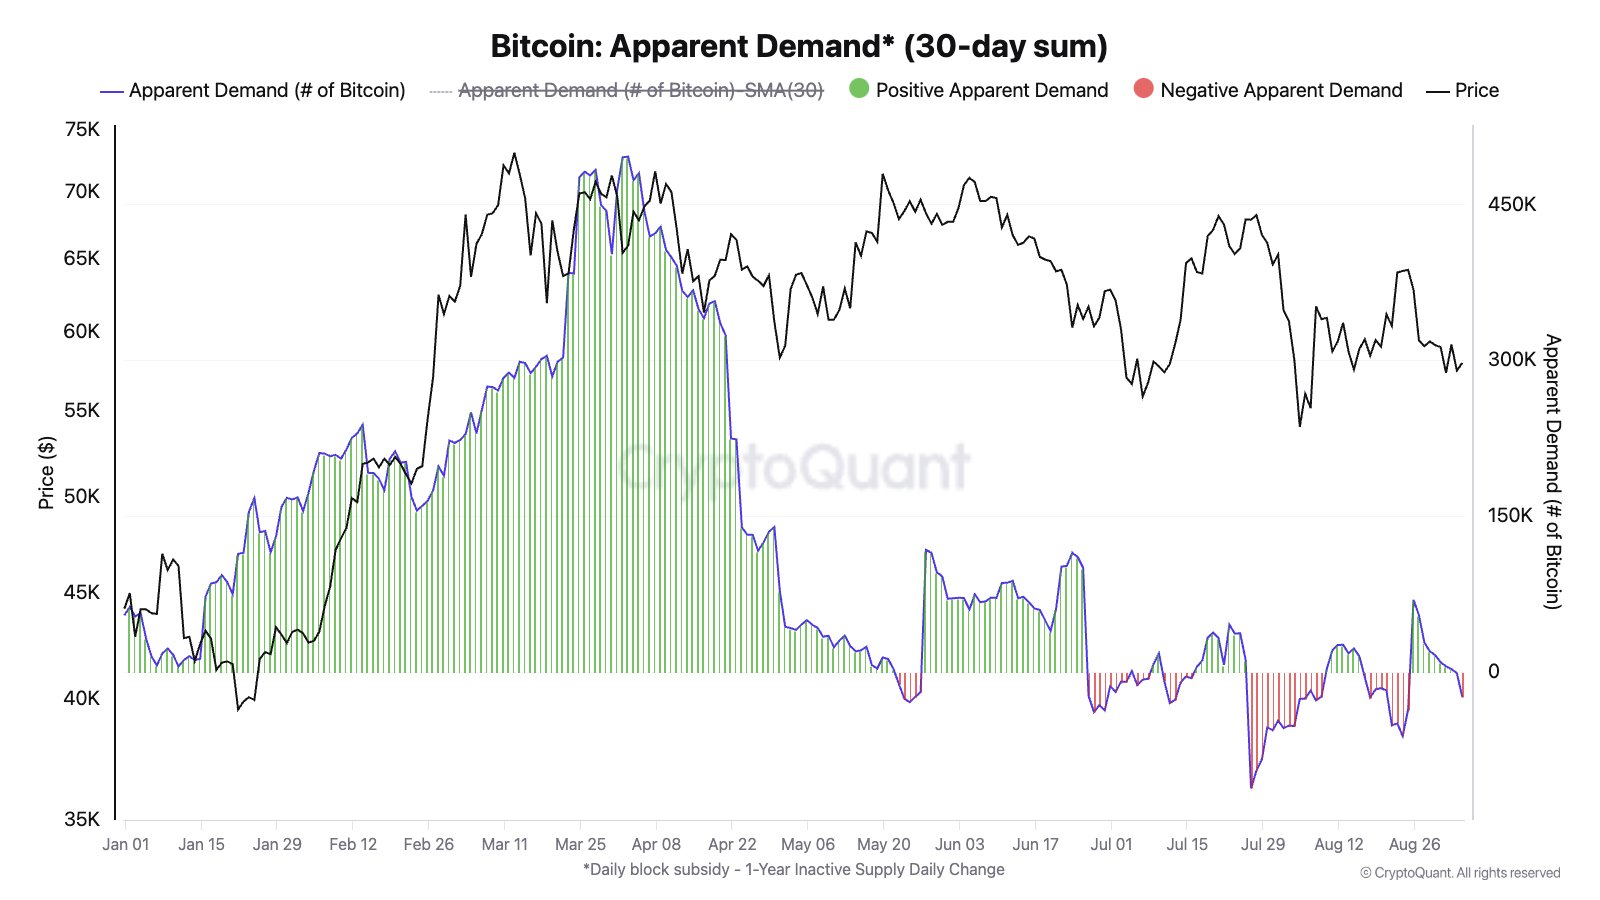
According to the above graph, demand for Bitcoin had been high earlier in the year, according to this indicator. Still, after peaking in April, the indicator sharply declined towards zero.
Since then, the Apparent Demand has continued to consolidate around this neutral level, which may be why the cryptocurrency’s price has been locked in an overall bearish trajectory.
The second indicator that the CryptoQuant head has cited is the Bitcoin Bull-Bear Market Cycle Indicator. This metric combines a few BTC indicators related to profit and loss to produce one value that sums up the entire market.
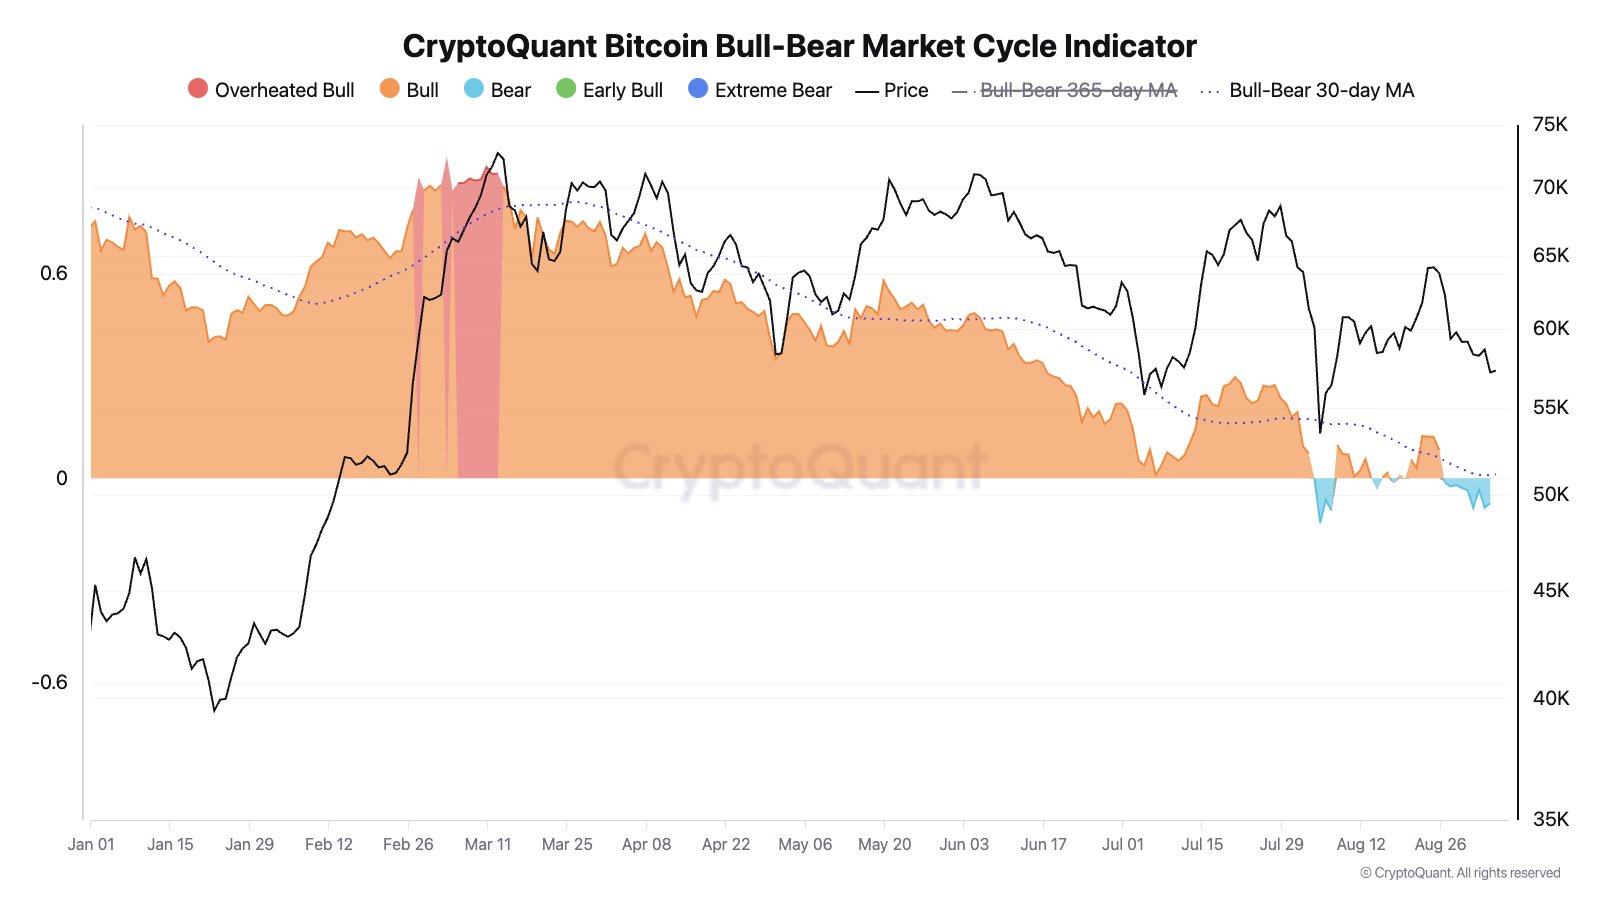
From the graph, it’s visible that the the asset had been inside the historical “Overheated Bull” region from the perspective of CryptoQuant’s Bull-Bear Market Cycle Indicator back when its price had set the all-time high (ATH).
After the coin had cooled off from this top, the indicator flashed a normal “Bull” signal, just like it had done in January and February. These bull market conditions were maintained until the crash early last month.
During this plunge, BTC dropped below $50,000, and the Bull-Bear Market Cycle Indicator flagged the market as “Bear.” Since then, the indicator has continued to consolidate around the transition boundary, jumping back and forth between Bull and Bear signals.
In the past week or so, though, the metric has consistently maintained inside the Bear region, which may be why Bitcoin has registered a drawdown of 6% in this window.
Moreno has also pointed out a price level to watch, as BTC is quite close to retesting it. The level in question is the lower band of the average cost basis of the BTC traders.
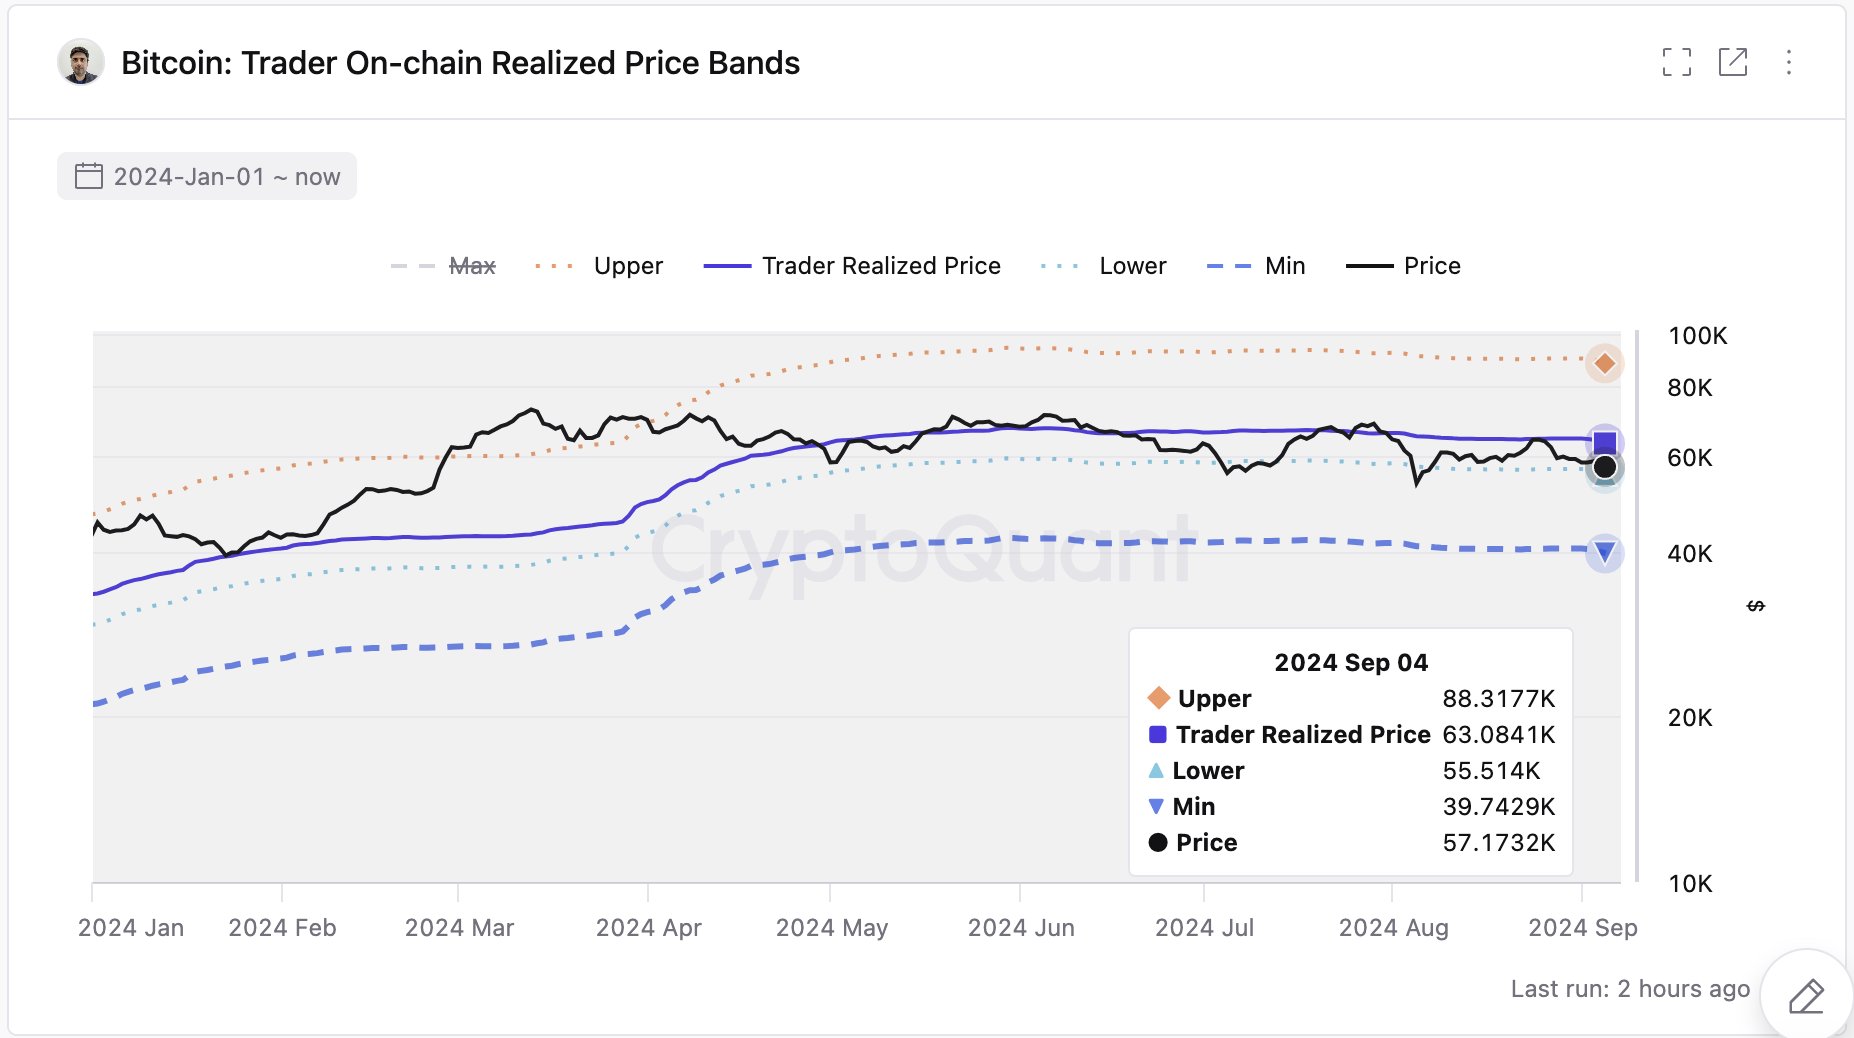
At present, this level is situated around $55,500. It remains to be seen how a retest of this level goes if the cryptocurrency continues its decline.
BTC Price
Bitcoin is currently trading around $55,900, which means the coin is pretty close to retesting the trader above the cost basis level.
In This News
Coins

$ 64.51K
-0.36%
$ 0.00693
-2.06%
$ 0.00...361

$ 0.000399

$ 0.000369


Predictions Markets
See what traders are focused on
Share:
In This News
Coins
$ 64.51K
-0.36%$ 0.00693
-2.06%$ 0.00...361
$ 0.000399
$ 0.000369
Predictions Markets
See what traders are focused on
Share:
Read More

Rising U.S. 30-Year Treasury Yield Creates Headwinds for Bitcoin, Analyst Warns