PEPE Price Is Compressing: Which Way Does It Break From Here?

Share:
PEPE has dropped 2.36% to about $0.000002747 with daily volume near $173 million (down over 17%), and short-term price action is dominated by a downtrend. The token is compressing into a symmetrical triangle, raising breakout risk either way: a break above $0.000002779 (and a potential golden cross) could trigger upside, while failure risks support at $0.000002715 or a deeper slide below $0.000002680 amid a recent death cross. Technicals are bearish—MACD sitting just below its signal line and RSI around 38—indicating weak token performance and elevated market risk for crypto and DeFi traders.
Predictions Markets
See what traders are focused on

- PEPE is currently hovering around $0.0000027.
- Downtrend dominates the short-term price action.
The frog-themed meme coin, PEPE, has dropped 2.36% in value and is currently hovering at around $0.000002747. Its daily trading volume is at $173 million, with over a 17% plunge. At first glance, the price action appears bearish. However, a closer look at the chart shows PEPE forms a symmetrical triangle, suggesting it is compressing ahead of a potential breakout in either direction.
The price is compressing into a tighter range, with buyers consistently defending higher lows. As volatility contracts, the likelihood of a significant move increases. A decisive breakout above the triangle’s resistance signals bulls regaining control and paves the way for the next leg higher. Meanwhile, declining trading volume during triangle compression is considered a normal pattern.
PEPE Price Outlook: Key Support and Resistance Levels
The short-term price momentum depends on a few important upcoming ranges. If the recent fall intensifies, PEPE’s immediate support might be at $0.000002715. With the emergence of the death cross, a deeper zone could form below $0.000002680, which acts as the area deciding whether it stalls or continues to slip.
On the flip side, upon the bulls entering, the first resistance level of PEPE could likely be at $0.000002779. It can show stronger momentum with the golden cross taking place. A fierce move above the $0.000002779 range confirms that the buyers gain control. Gradually, the asset may have higher targets aimed to be broken.
What Is PEPE’s Technical Chart Structure Pointing To?
Zooming in on the four-hour chart, the Moving Average Convergence Divergence line is just 1 point below the signal line. As the gap is tight, a bearish crossover has either just triggered within the last candle. Both lines are found below zero, and the broader market environment is bearish.
Sellers are attempting to push price lower again, but the PEPE momentum has not aggressively expanded yet. If the distance grows wider and the MACD line pulls further away below the signal line, it confirms that selling pressure is accelerating to resume the downtrend.
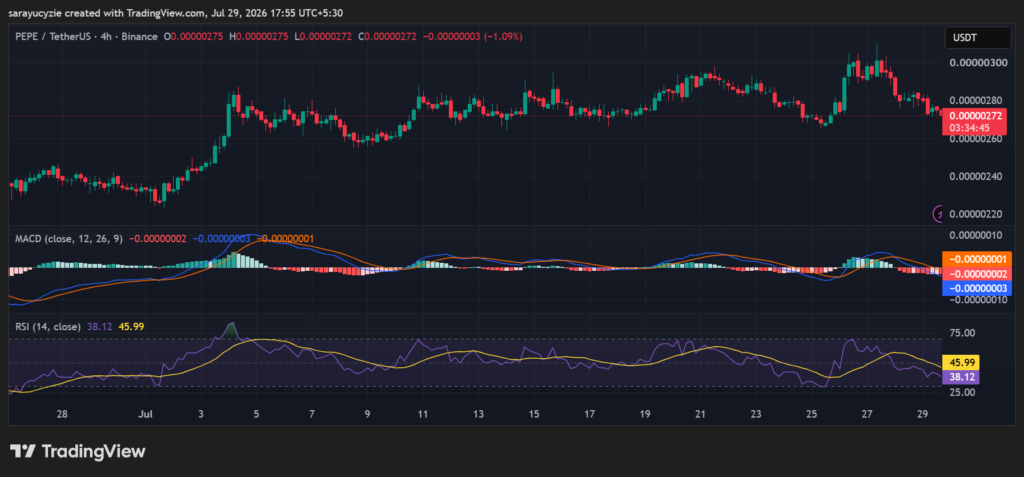
In addition, PEPE’s daily Relative Strength Index (RSI) is resting at around 38.12 and sits in bearish territory, nearing oversold levels. The reading below the neutral 50 level confirms that downtrend dominates the short-term price action. While the selling pressure is strong, the asset is not yet oversold.
There is still room for price to slide lower before reaching extreme levels. The bears are driving the market, but it has not hit an extreme point yet. Also, the traders look at this as an active downward wave that either continues toward 30 or consolidates before finding support.
Crypto Market Highlights
Make-or-Break for Solana (SOL): The Clock is Ticking, and the Streak is on the Line
In This News
Coins

$ 74.60
+1.87%
$ 0.00...278
+2.16%
$ 0.0000674
-8.64%

$ 0.0000103


Predictions Markets
See what traders are focused on
Share:
In This News
Coins
$ 74.60
+1.87%$ 0.00...278
+2.16%$ 0.0000674
-8.64%$ 0.0000103
Predictions Markets
See what traders are focused on
Share:
Read More

Crypto Regulation: SEC Keeps Clarity Act Option Open As South Korea Confirms 2027 Crypto Tax