Bitcoin Slips Under 200-Day Moving Average – Will The Downtrend Continue?

Share:
Predictions Markets
See what traders are focused on

Bitcoin (BTC) has dropped 11.3% over the past week, currently trading in the low $80,000 range at the time of writing. The recent decline has pushed the leading cryptocurrency below the 200-day moving average (MA), raising concerns about a potential deeper pullback.
Bitcoin Must Defend This Key Price Level
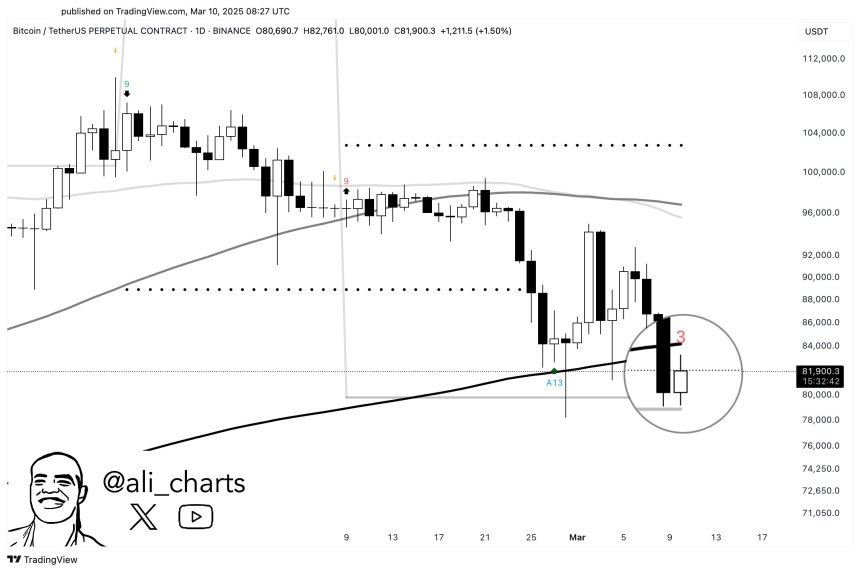
According to an X post by seasoned crypto analyst Ali Martinez, BTC is now trading below the 200-day MA, a key price level that has historically functioned as a strong support for the top digital asset.
For the uninitiated, the 200-day MA is a famous technical indicator that essentially represents the average closing price of BTC over the last 200 days to identify the long-term price trend. Historically, a sustained movement above the 200-day MA has led to long-term uptrends while a prolonged price movement below the level has often preceded further declines.
Martinez stressed that BTC must remain above the TD Sequential indicator’s risk line at $79,280. He added that a sustained move above this level could set the stage for a strong rebound to the upside.
The potential for a BTC recovery was echoed by fellow crypto analyst Ted. In a post on X, he pointed out that over the past two years, BTC has frequently undergone 25% to 30% corrections before rebounding to new all-time highs (ATHs). Ted noted:
In 2023, BTC went from $30K to $22K. In 2024, BTC went from $74K to $50K. This year, BTC has dumped from $109K to $79K. We all know what happened after the last 2 major corrections.
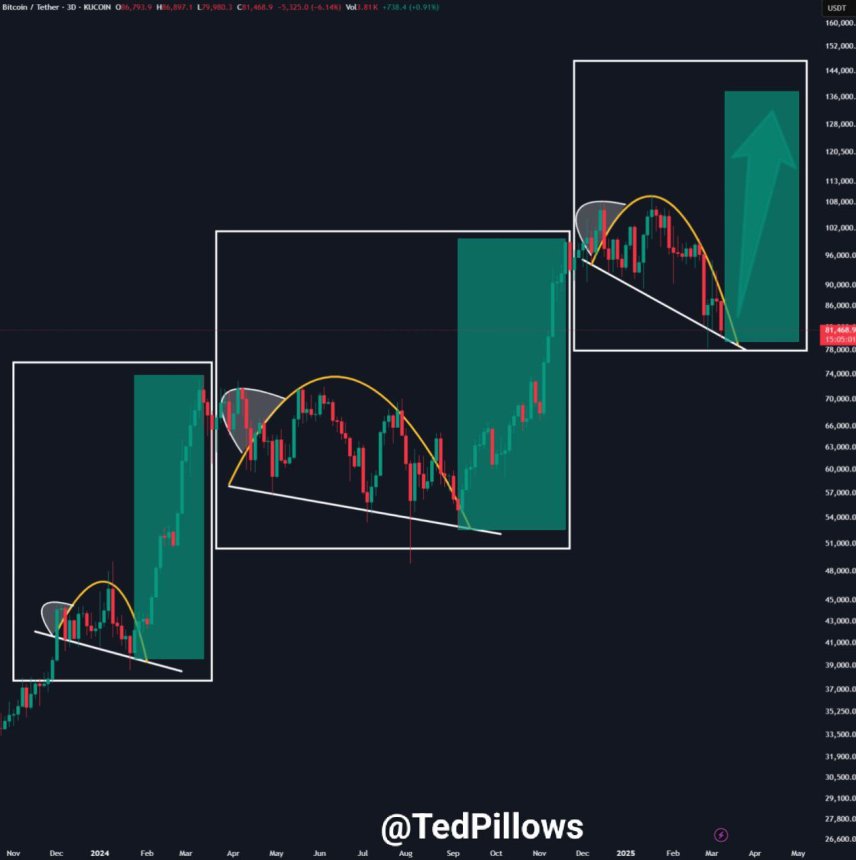
If BTC follows a similar pattern and climbs 30% from its current price, it could reach approximately $104,000 in a short period. However, broader macroeconomic factors – such as US President Donald Trump’s trade tariffs and the Federal Reserve’s (Fed) monetary policy – could significantly impact BTC’s trajectory.
BTC Needs To Reclaim $84,000 First
In another post on X, Martinez outlined BTC’s potential path to a new ATH, emphasizing that BTC must first reclaim $84,000 as a support level before any major upside movement. Once this milestone is secured, the digital asset could rally toward $128,000.
Several indicators suggest that BTC may have already found a local bottom, increasing the chances of a trend reversal. Crypto analyst Rekt Capital recently noted that BTC’s plunge to $78,258 could mark the cycle low.
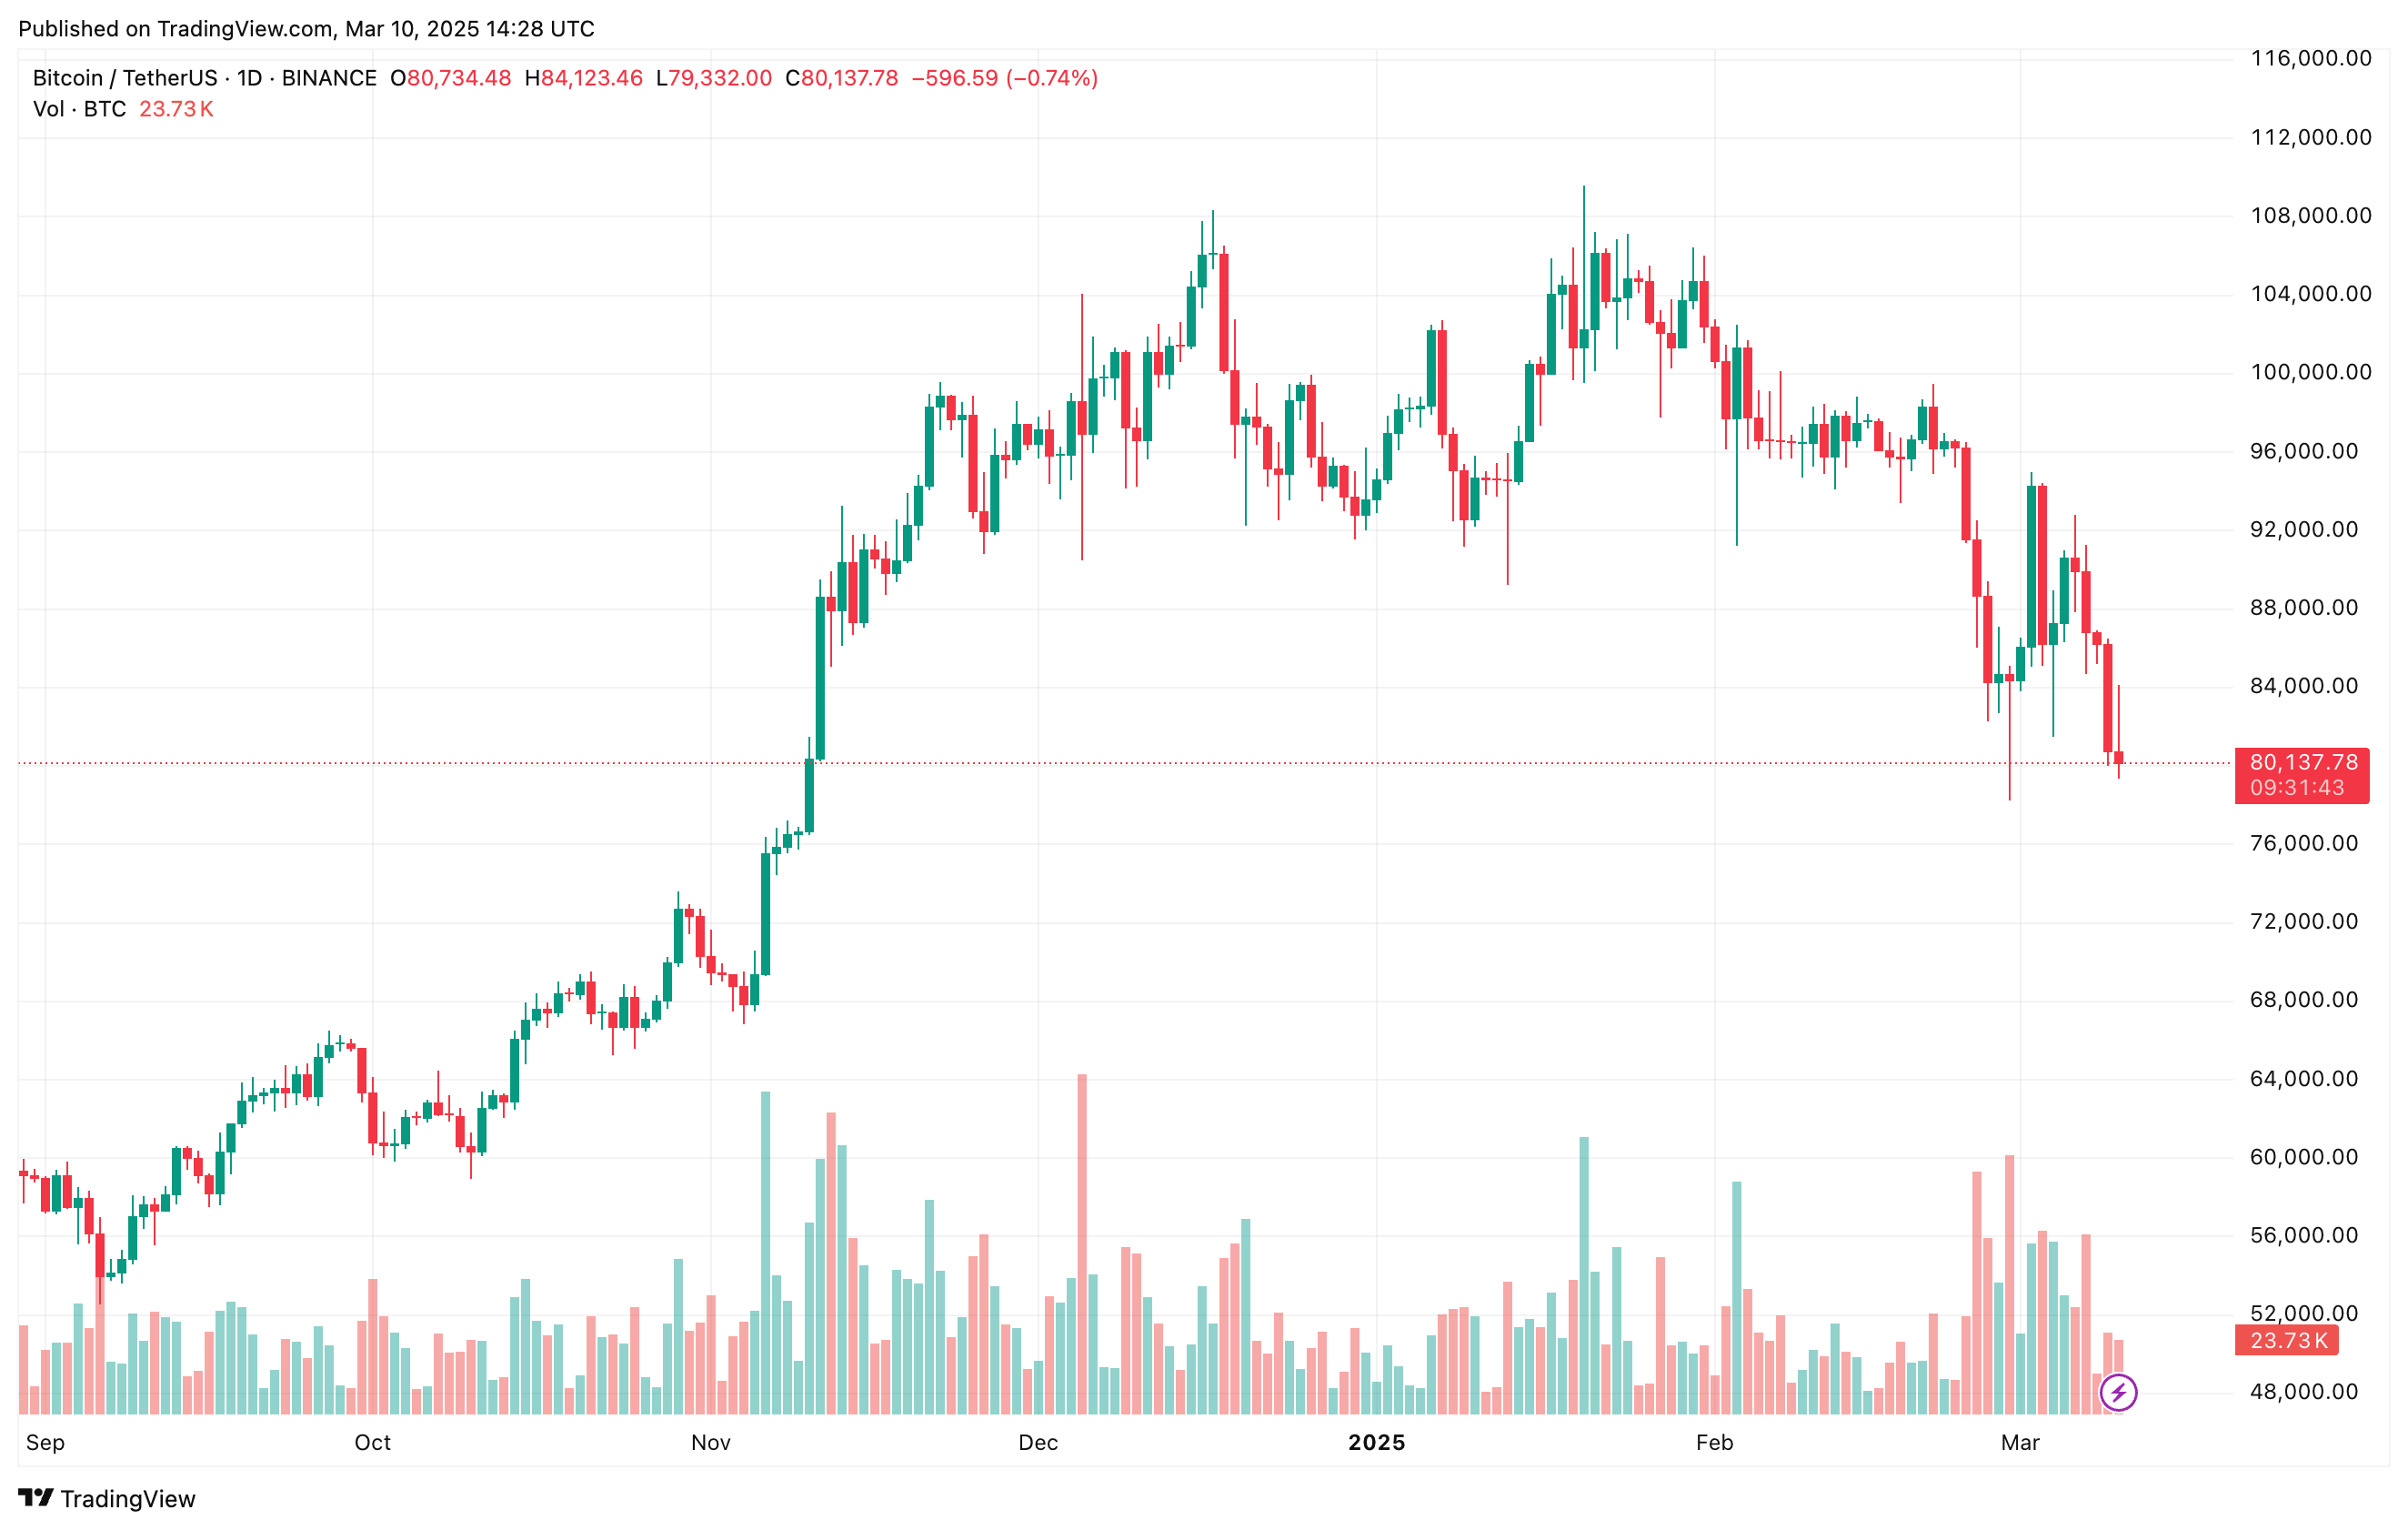
Additionally, the US Dollar Index (DXY) has just recorded one of its largest weekly breakdowns since 2013, a move that historically signals bullish momentum for risk-on assets like BTC. At press time, BTC trades at $80,137, down 3.5% in the past 24 hours.
In This News
Coins

$ 64.08K
+2.25%
$ 0.00714
-0.94%
$ 0.00...361

$ 213.96

$ 0.000399


Predictions Markets
See what traders are focused on
Share:
In This News
Coins
$ 64.08K
+2.25%$ 0.00714
-0.94%$ 0.00...361
$ 213.96
$ 0.000399
Predictions Markets
See what traders are focused on
Share:
Read More

Bitcoin gets a green light from a reliable momentum gauge. Here are key levels to watch