
Crypto Market Recap: Q2 2026
Share:
 CryptoRank
Share:
Key Takeaways:
- Altcoin participation deteriorated sharply. In June, 82.1% of Top-100 assets declined, while all 8 tracked narratives posted negative median returns.
- On-chain activity remained compressed. Sector fees fell by 44.6% on average compared with the prior YTD period
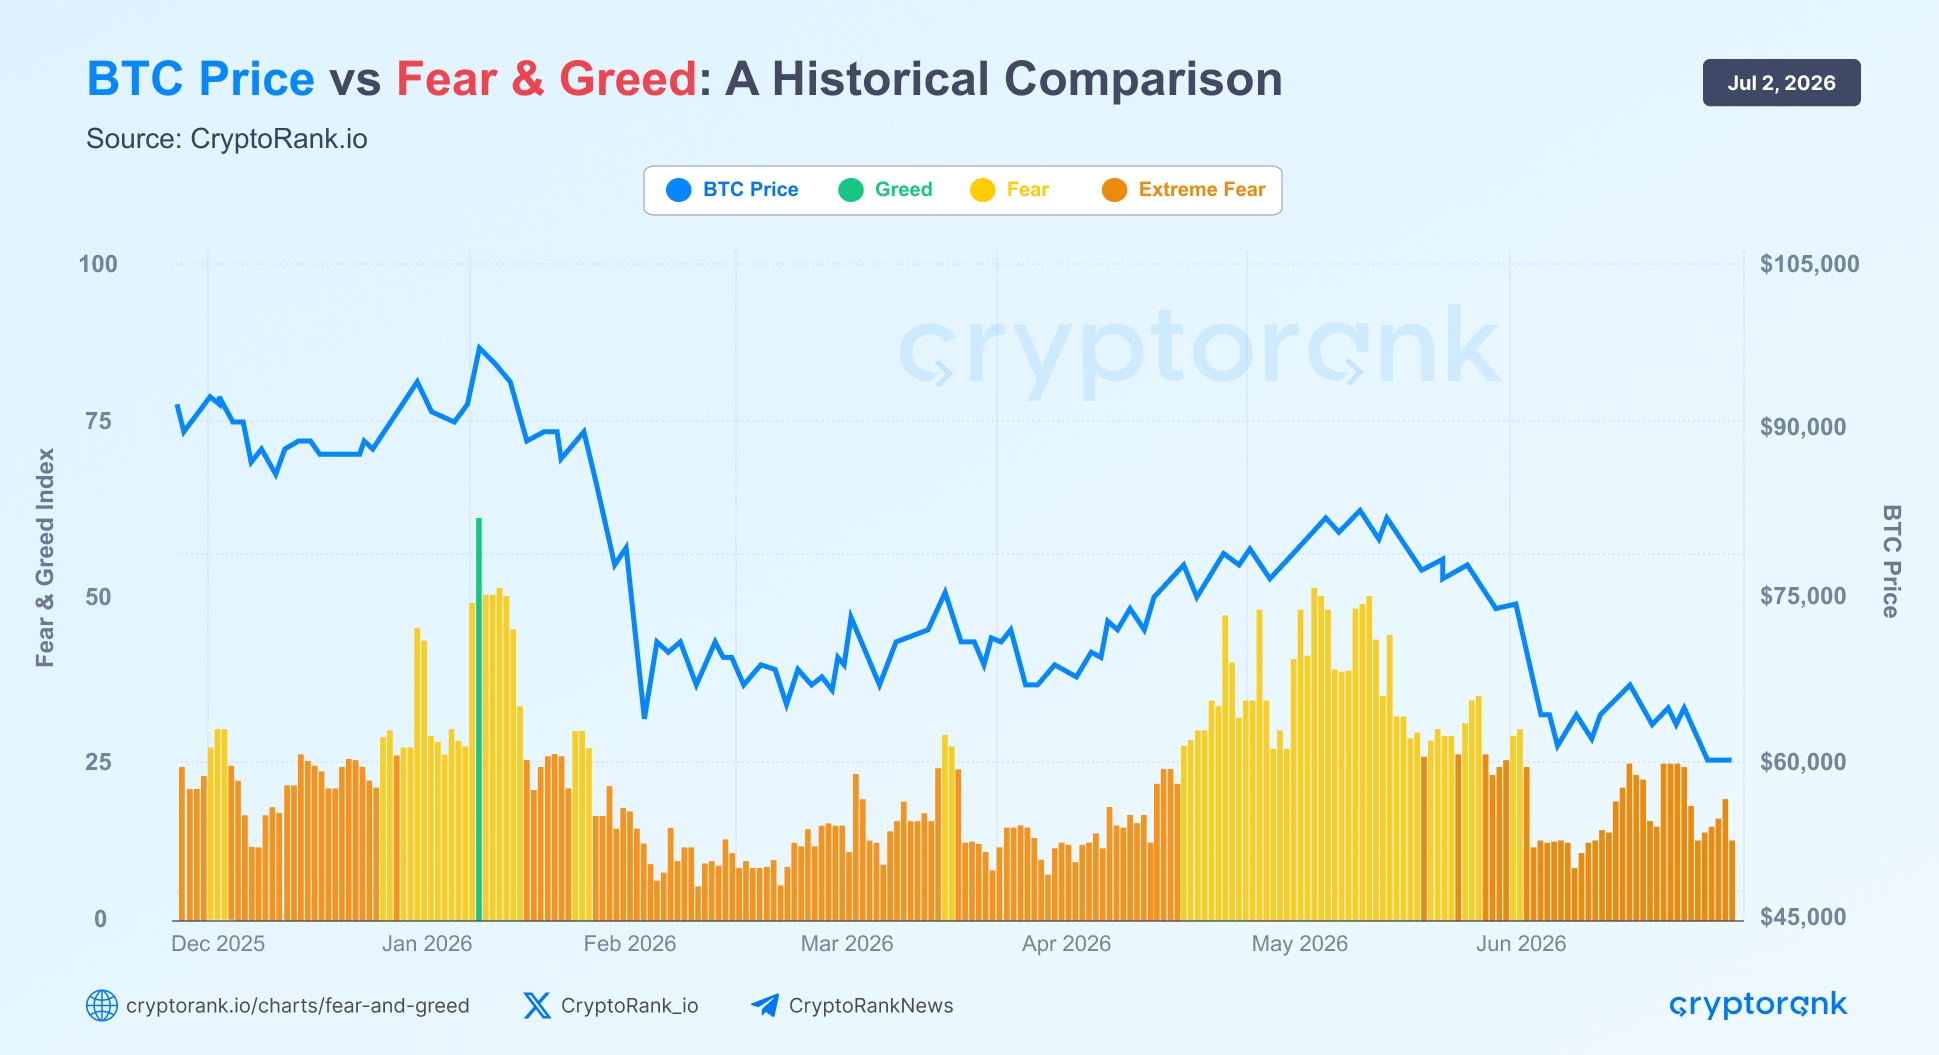
- Sentiment stayed extremely cautious. The Fear & Greed Index remained in Extreme Fear throughout most of Q2
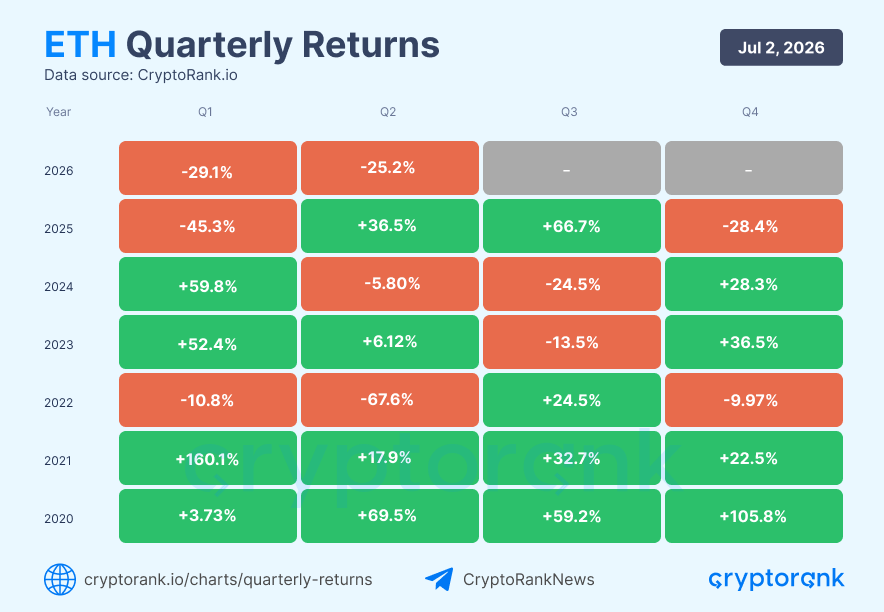
- Ethereum underperformed structurally. ETH recorded its first-ever three-quarter losing streak
Introduction
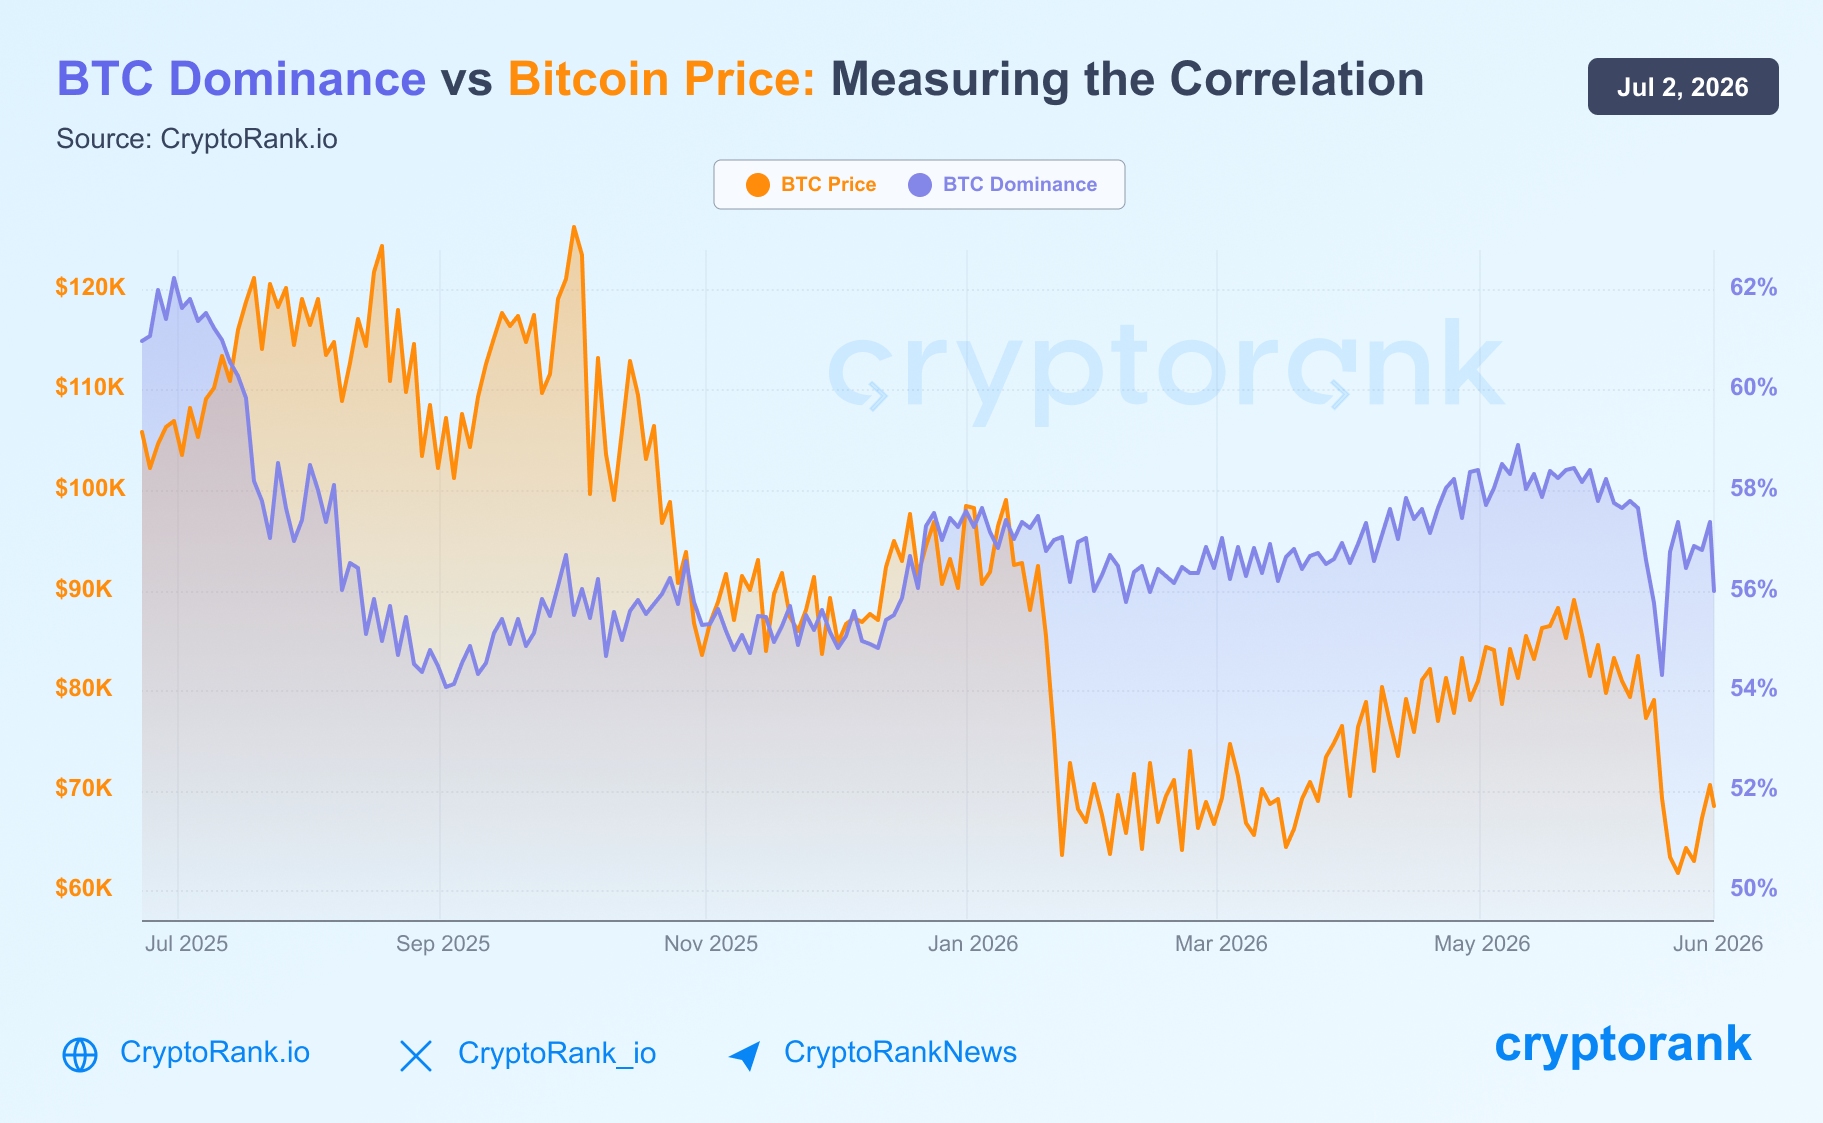
Q2 2026 ended with a much weaker market backdrop than the headline price action suggests. Market breadth deteriorated sharply in June, fees declined across every major on-chain sector by 44.6% on average. While the sentiment fell back into extreme fear, Bitcoin remained structurally resilient near the 200-week moving average, and its dominance stayed above 55.2%, showing that capital continued to concentrate in the largest and most defensive asset.
This was a selective and defensive market environment, where Bitcoin held up relatively well while altcoin participation, on-chain monetization, and investor confidence remained under pressure.
1. Market Breadth Collapsed in June
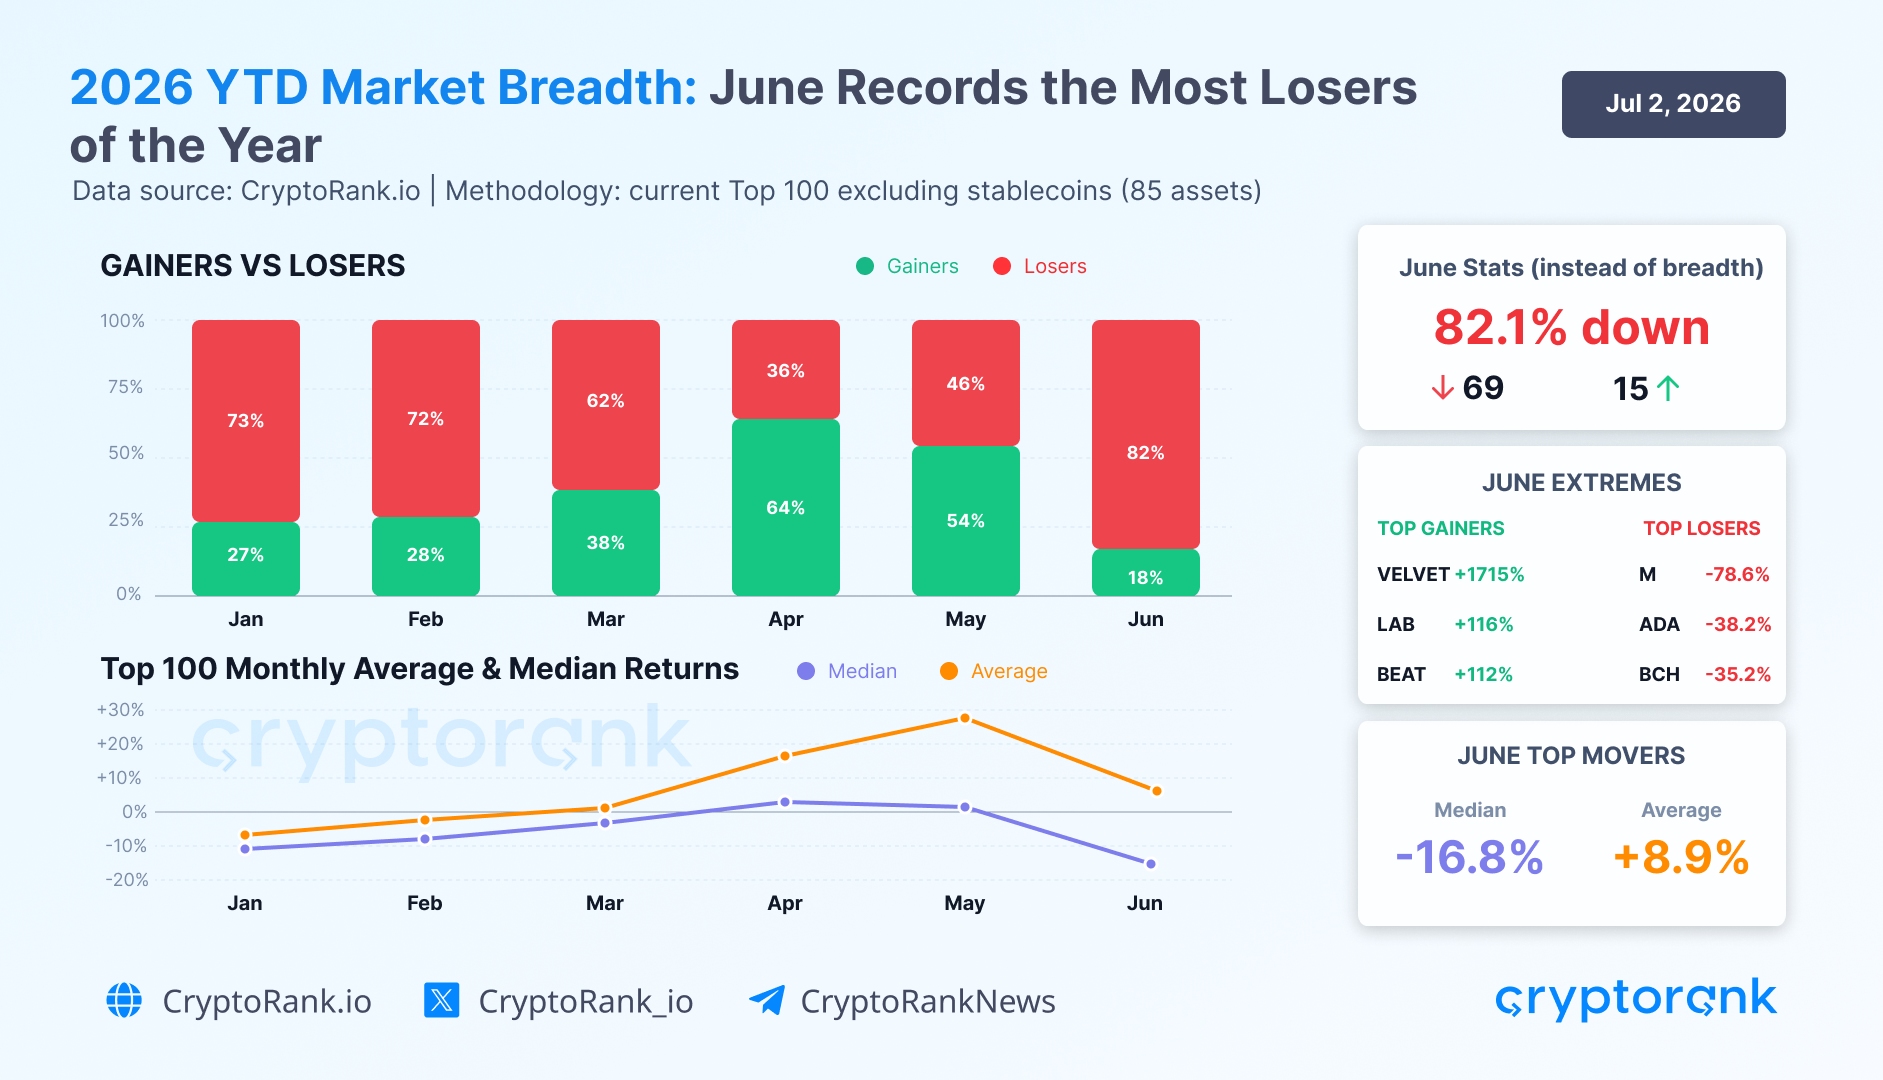
The market breadth data shows a clear deterioration in participation across the current non-stablecoin Top 100 assets. In June, breadth weakened to its worst level of 2026 so far:
-
82.1% of top-100 assets declined
-
Median return: -16.8%
-
Average return: +8.6% (average was affected by the VELVET, which gained +1,715%)
Source: CryptoRank API
This stands in sharp contrast to April, which was the strongest month of 2026 so far, when 64% of the top-100 assets gained in price. After that, May already showed a more fragile structure, but June confirmed a full reversal in participation.
The dispersion of returns also matters. Even in a weak month, there were still a few strong outliers:
Top gainers in June
-
VELVET (+1715%) benefited from rising interest in on-chain trading infrastructure and pre-IPO perpetuals.
-
LAB (+116%) rallied as interest returned to AI trading terminals and on-chain execution tools.
-
BEAT (+112%), the token of the Audiera Web3 entertainment and rhythm-gaming ecosystem, rose on the token burn news, making the rally highly momentum-driven.
Top losers in June
-
M (-78.6%) collapsed sharply as confidence weakened around high-FDV meme infrastructure assets.
-
ADA (-38.2%) underperformed amid broader market weakness and fading sentiment around the Cardano ecosystem.
-
BCH (-35.2%) declined as liquidity rotated away from older payment-focused altcoins.
2. Narrative Overview: All Key Narratives Turned Negative
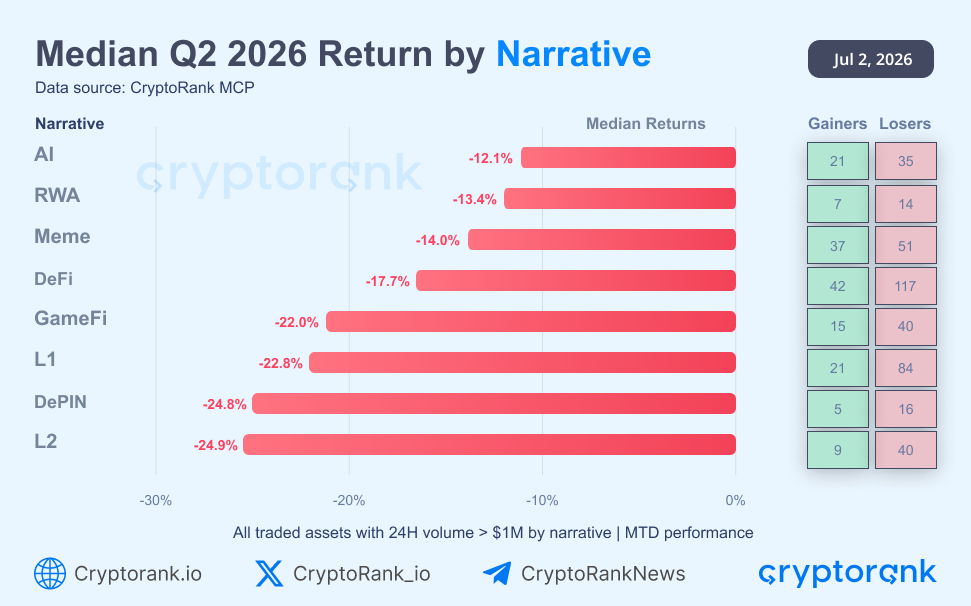
Narrative-level performance looked weaker than the top-100 token sample. Among all traded assets with 24-hour volume above $1M, none of the eight tracked narratives posted a positive median return.
Source: CryptoRank API
This liquidity-screened view changes the market interpretation. In the top-cap sample, some narratives could appear relatively resilient, but among all traded assets, weakness was systemic. The decline affected nearly the entire liquid altcoin market.
The gainers-versus-losers split shows this most clearly. Even in the strongest narratives, decliners outnumbered advancers, with AI posting 21 gainers against 35 losers and DeFi posting 42 gainers against 117 losers. Isolated strong tokens were not enough to offset weak breadth within each category.
The weakest narratives were Layer 2 chains (-24.9%), DePIN (-24.8%), and Layer 1 chains (-22.8%), pointing to pressure across both infrastructure and base-layer segments.
All 8 tracked narratives posted negative median returns, with losers outnumbered gainers in nearly every category, confirming that the market remained defensive and narrow through Q2 without a broad recovery in breadth.
3. Fees by Market Sector: On-Chain Activity Remained Compressed
Sector-level fee data confirms that the weakness was not limited to token prices. Year-to-date fees are down across every major market sector compared with the prior YTD period, by 44.6% on average. L1 and DEX remain the largest fee-generating sectors, but even these core segments contracted by 26% and 53%, respectively.
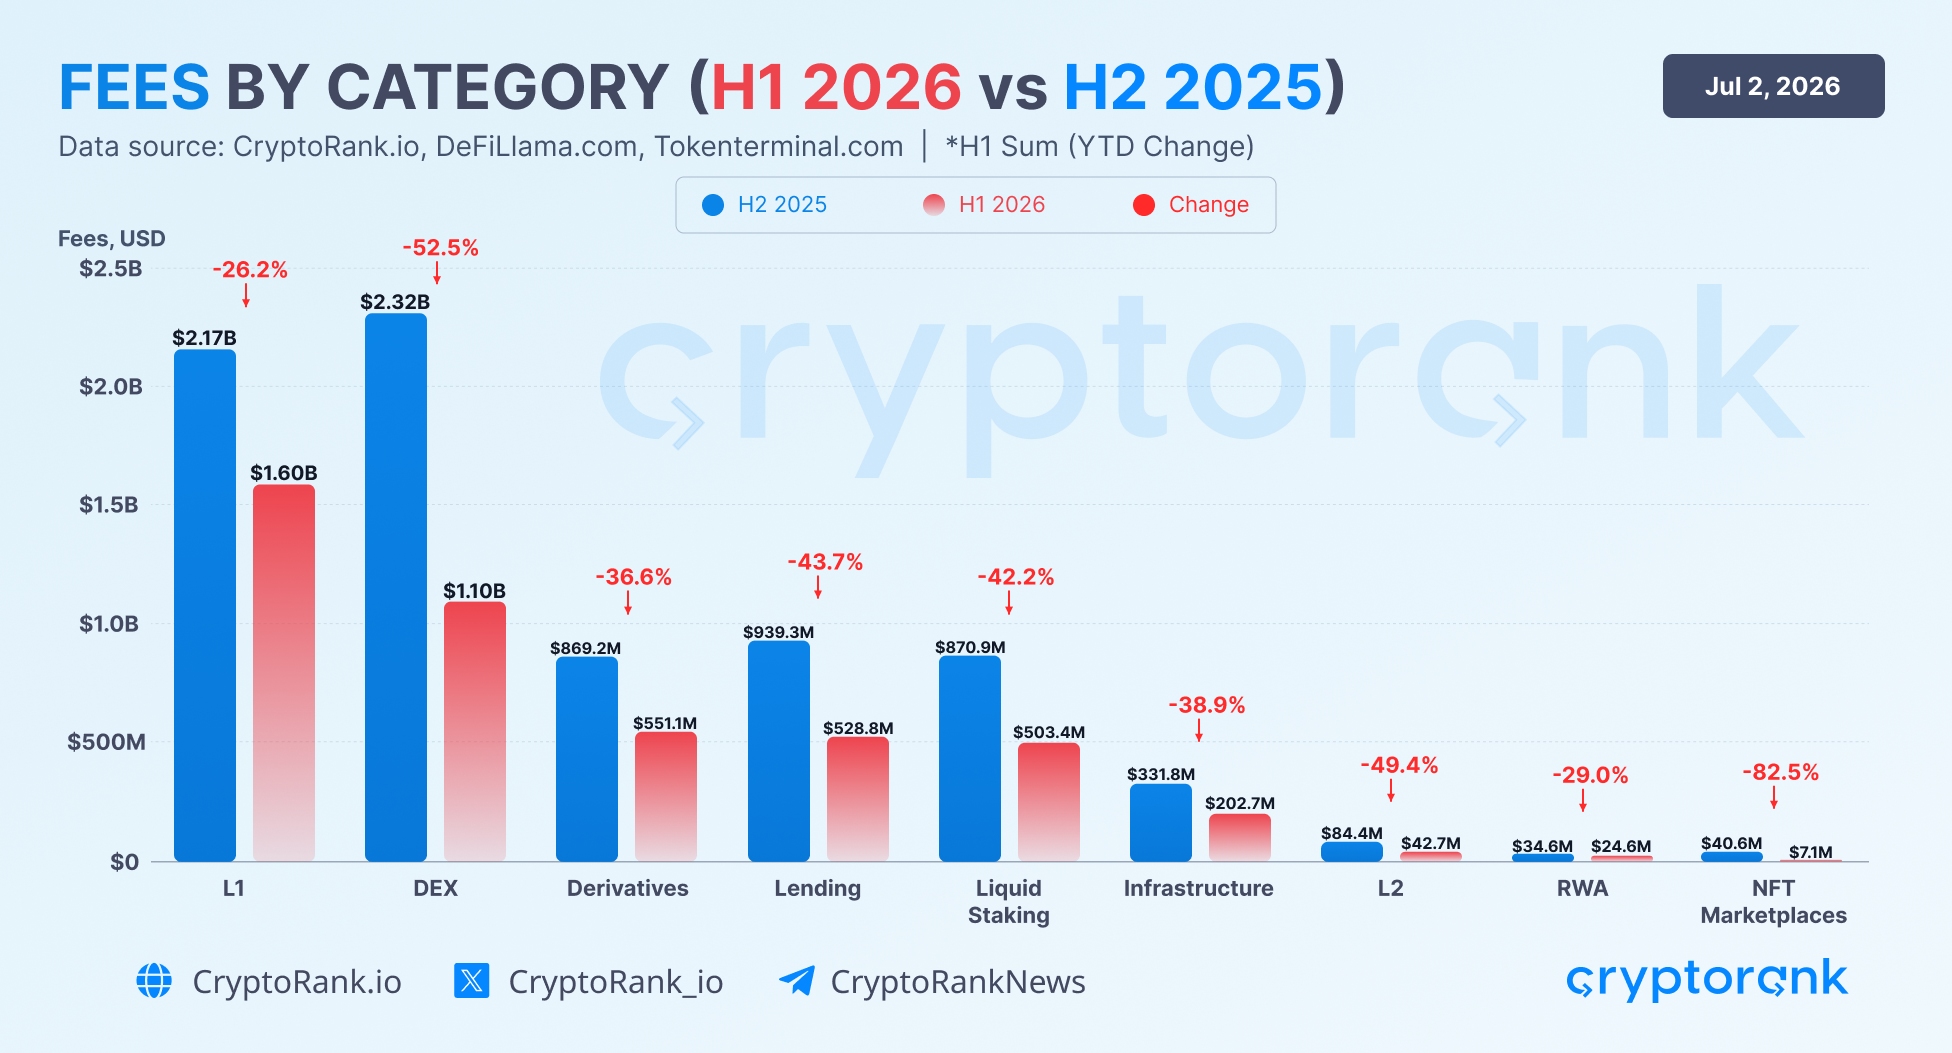
The steepest drop came from NFT marketplaces at 82%, while RWA, L2, lending, and liquid staking also posted sharp declines of 29%, 49%, 44%, and 42%.
This points to a broader slowdown in on-chain monetization. User activity may still be present, but translated into less fees than in the prior period. The market stayed active but less profitable and less expansive, reinforcing that Q2 was a slower, more selective phase.
4. Bitcoin Reached the 200-Week Moving Average
Historically, the 200-week moving average has served as:
-
A long-term trend indicator.
-
A major accumulation zone.
-
Еhe boundary between a structurally resilient market and a deeper bearish phase.
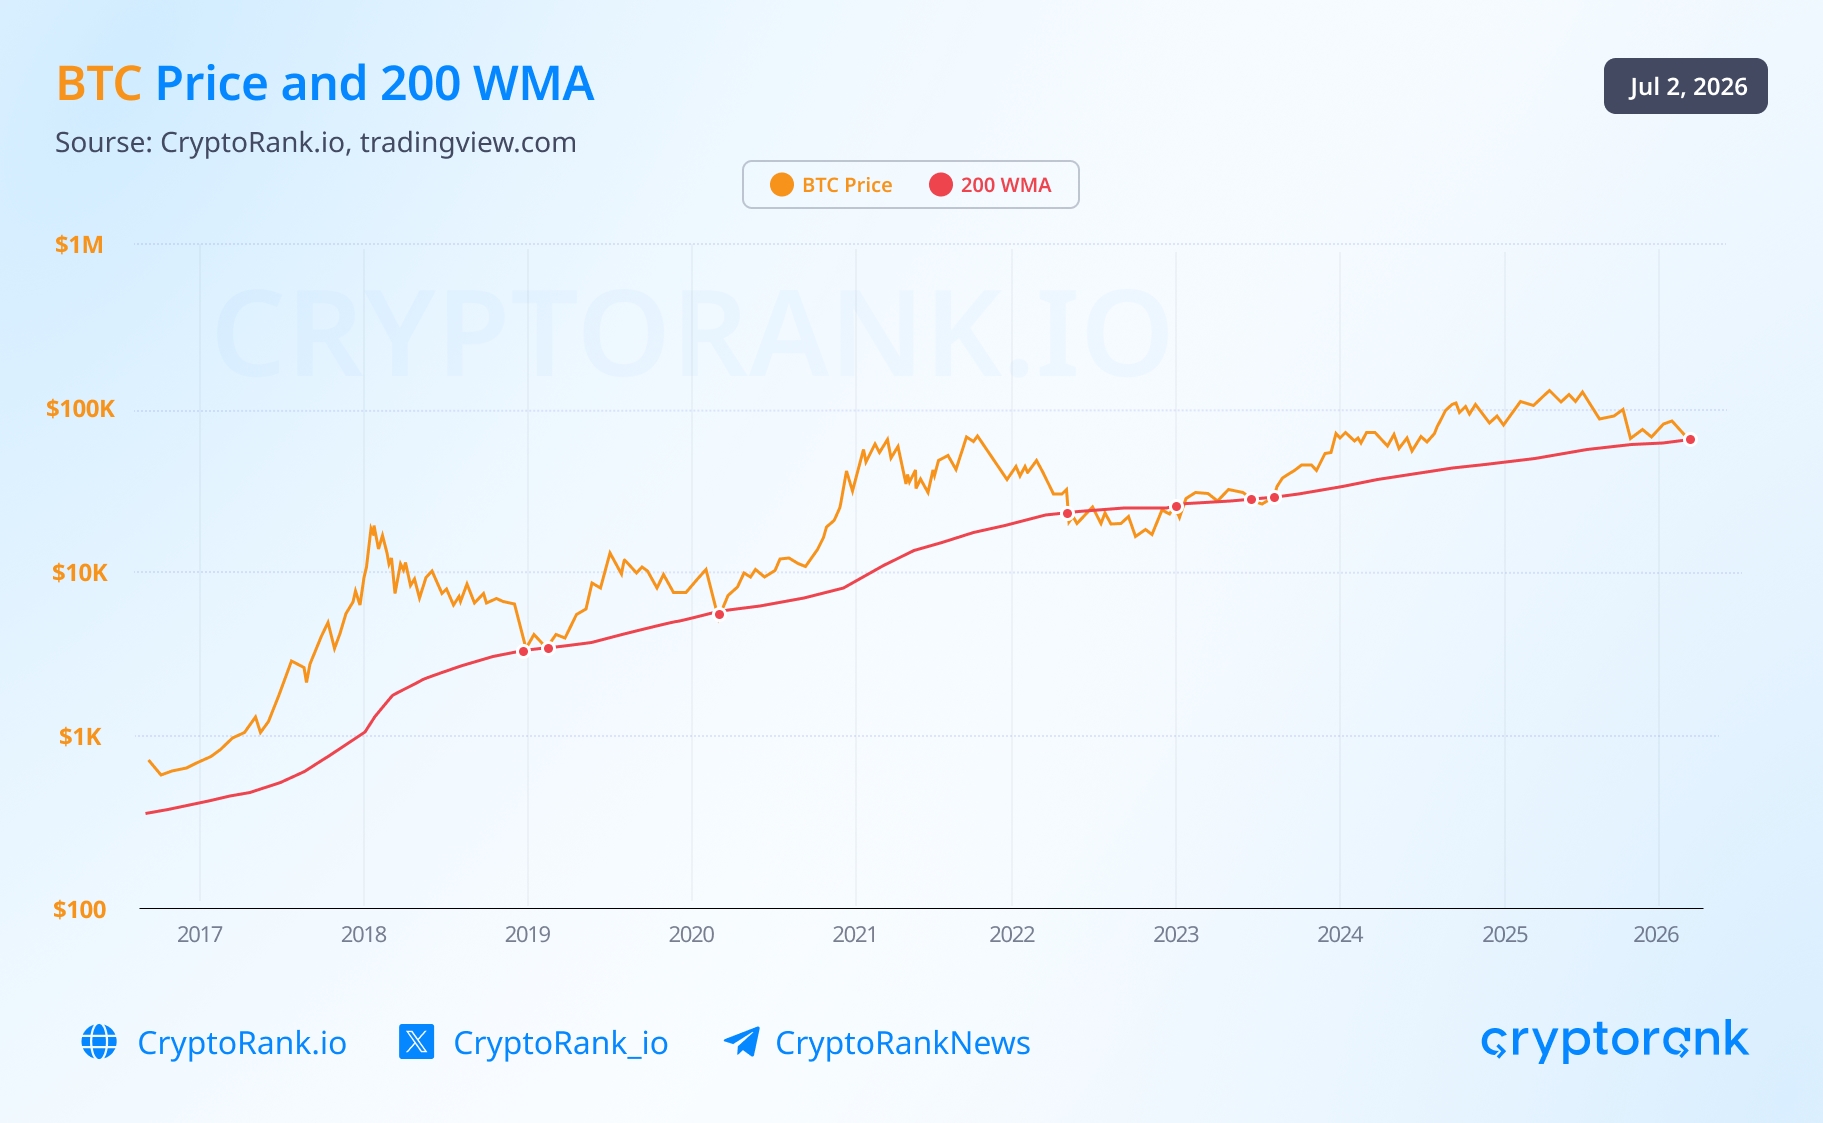
Throughout Q2 2026, BTC traded around its 200-week moving average (200 WMA) but finished June below this level. Holding near this benchmark will be crucial in the coming weeks, as a sustained break below it could increase the risk of a deeper market downturn.
5. Market Structure Turned More Defensive
5.1 Bitcoin Dominance Stayed Elevated
The Bitcoin Dominance chart shows that BTC dominance stood at nearly 56% by the end of Q2. Over the first half of 2026, BTC dominance stayed in the range between 54% and 59%.
Source: Global Market Data Dashboard
The rising or elevated BTC dominance typically reflects a defensive allocation pattern:
-
Capital rotates away from weaker altcoins.
-
Investors prioritize liquidity and relative safety.
-
The market narrows around Bitcoin.
Despite the ongoing outflow of capital from altcoins into stablecoins, Bitcoin continues to capture an ever-larger share of the remaining risk capital. Under these conditions, BTC serves as the primary volatile asset that investors remain willing to hold, which reinforces its relative strength compared to the altcoin market as a whole.
5.2 Fear & Greed Remained in Extreme Fear Throughout Q2
As of the end of June, the Crypto Fear & Greed Index stood firmly within the Extreme Fear zone. More notably, throughout the entire second quarter, the index exceeded 50 on only one day, which highlights the persistently cautious sentiment that dominated the market. This indicates that investors remained highly risk-averse.
Source: CryptoRank API
5.3 Ethereum Records Its First-Ever Three-Quarter Losing Streak
Ethereum finished Q2 2026 down 25%, extending its losing streak to three consecutive quarters, the first such occurrence in the asset's history. Today, the market remains under persistent selling pressure.
Source: Quarterly Returns
Despite the recent weakness, Ethereum's long-term quarterly record is still constructive. Since 2020, 16 of 26 quarters have delivered positive returns, with an average quarterly gain of 20%. The current cycle stands out for its slower recovery and increasingly selective capital allocation across the crypto market.
Conclusion
The market is still in a reset and consolidation phase, not a fully restored expansion cycle. Bitcoin's resilience near the 200-week moving average suggests the long-term structure has not broken, even as the broader market remains fragile, offering a base to build from rather than a floor already tested and failed.
A durable recovery in H2 2026 would require several signals to move together: an improvement in market breadth, stabilization or recovery in sector fees, a decline in BTC dominance driven by healthier altcoin performance, and sentiment moving out of the fear zone. Whether these align will determine if the market transitions into a broader recovery, or if Q2 turns out to be another pause in a cycle that has yet to prove itself fully intact.