
Ethereum Liquidation Risk Mounts as $547 Million in DeFi Positions Near Critical Levels

Share:
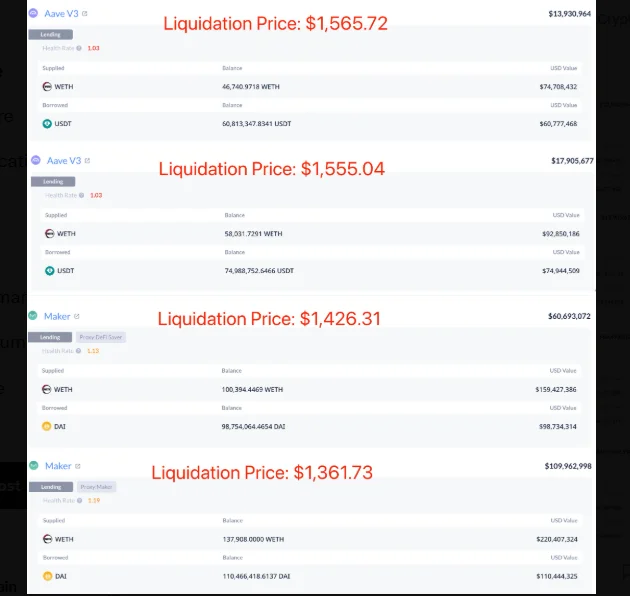
Roughly 343,075 ETH (about $547 million) of leveraged positions are exposed to liquidation across DeFi, with major concentrations including 137,908 ETH at $1,361.73, 100,394 ETH at $1,426.31 on Maker and 58,032 ETH ($92.85M) on AAVE V3 at $1,555.04. Ethereum has broken below its ascending channel and a high-volume support zone, and with many liquidation levels clustered above the $1,300 support, these DeFi liquidations raise significant downside risk for ETH and the broader crypto market.
Predictions Markets
See what traders are focused on

Ethereum is once again staring at a familiar crypto nightmare: leveraged positions stacked on top of each other while price action starts to crack.
According to data, a total of 343,075 ETH, worth roughly $547 million, is currently exposed to liquidation across DeFi protocols. The largest concentration sits at 137,908 ETH, with a liquidation level of $1,361.73, creating a significant pressure zone if the market continues moving lower.
Massive DeFi Exposure Hangs Over Ethereum
The liquidation map shows that several large positions are clustered across major DeFi lending protocols.
Data shared by Lookonchain reveals that 46,741 ETH ($74.71 million) would be liquidated on Maker at $1,565.72, while another 58,032 ETH ($92.85 million) on AAVE V3 faces liquidation at $1,555.04.
Further down the ladder, the numbers become even larger. Maker alone accounts for 100,394 ETH ($159.43 million) at $1,426.31 and 137,908 ETH ($220.41 million) at $1,361.73.
That’s a substantial amount of collateral waiting near key price thresholds.
Price Structure Starts Showing Weakness
Meanwhile, Ethereum’s chart isn’t exactly inspiring confidence. Recent price action shows ETH breaking below its ascending channel structure. At the same time, the anchored volume profile indicates that price has slipped beneath a high-volume trading zone that previously acted as support.
Markets often react aggressively when these heavily traded areas fail. Instead of attracting buyers, they can transform into resistance, increasing downside pressure.
Why The $1,300 Level Matters
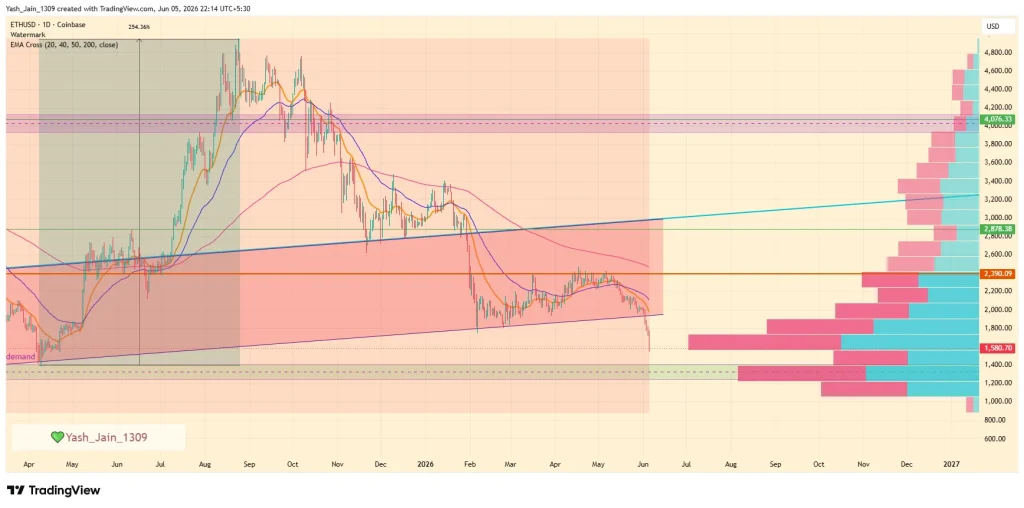
The next major area attracting attention is the $1,300 support zone. What’s notable is that most of the identified liquidation levels sit above this region. If ETH continues drifting lower toward that round-number support, a significant portion of the leveraged DeFi positions could come under pressure before price even reaches $1,300.
For now, Ethereum faces a difficult balancing act. The network’s DeFi ecosystem is carrying hundreds of millions of dollars in liquidation risk, while ETH price action continues testing increasingly fragile support levels.


