BNB Bulls Target $644 As Classic Chart Formation Emerges

Share:
Predictions Markets
See what traders are focused on

Binance Coin (BNB) is gaining fresh interest as investors closely watch a potential breakout. The token is facing resistance around $593, with daily trade volume at $1.24 billion. Its market cap is $83 billion. The current trend is being attributed to sustained buying interest and continuous technical cues.
Traders Identify Triangle Pattern On BNB Chart
Technical analysts are keenly watching a triangle price pattern forming on the chart of BNB against USDT’s 1-day chart. As analyst Andrew Griffiths explains, this formation is recognized for contracting price action, whereby the highs become lower and the lows become higher. It typically indicates a significant move in the near future, either higher or lower.
#BNB analysis on the 1D chart vs USDT shows price movement within a triangle pattern, indicating room for the current side trend. Potential targets: T1 = $599, T2 = $617, T3 = $644. For risk management, consider Stop-Loss levels: SL1 = $580, SL2 = $559, SL3 = $542, SL4 = $521.… pic.twitter.com/Qku1eChZ4R
— Andrew Griffiths (@AndrewGriUK) May 3, 2025
The graph indicates BNB trending in a narrower range for the past few sessions. Such a setup typically indicates that there is a breakout on the horizon. As BNB has been on an upward trend prior to this pattern forming, some assume it will keep going up—if the support zones hold. However, a breach below those support levels might reverse the trend and push the price down.

Price Targets Established At $599, $617, And $644
If BNB keeps surging, analysts have cited three possible targets. The first is $599, which is just below the psychological barrier of $600. The second is $617, a place where BNB fought to move above back in March.
The third is $644, which is the entire range of the triangle formation. These will likely be checkpoints if there is momentum.
Although short-term bullish indications are there, the token has not yet breached any of these levels. For now, BNB is probing a significant level of support and resisting. This type of price action is typical before bigger moves in either direction.
 BNB: The 32% Prediction
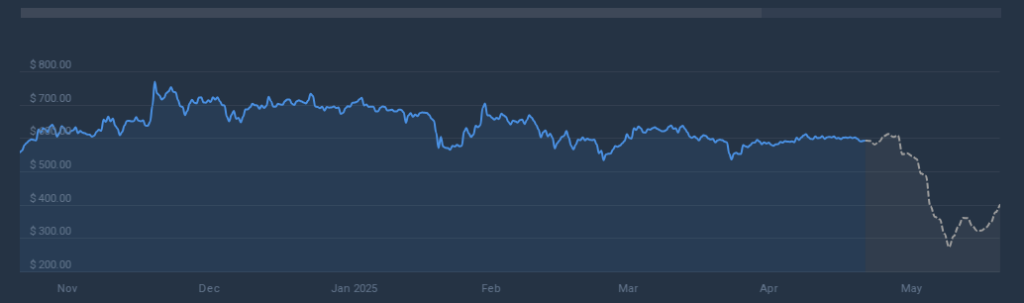
In spite of all the short-term hype, a different forecast shows BNB plummeting in the next year. Based on a price forecast, the token might decline by 32% and hit $402 on June 4, 2025. That prediction doesn’t coincide with the existing chart strength, creating an extra layer of uncertainty for long-term investors.
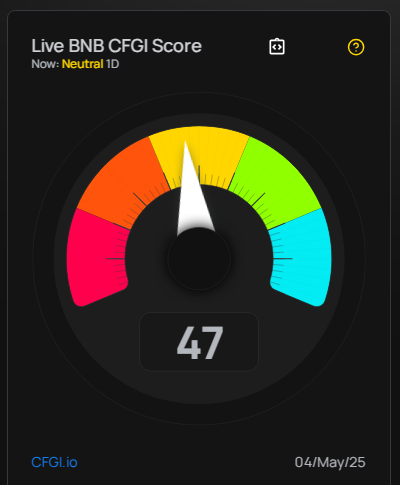
BNB has experienced 15 green days out of the past 30, and its price volatility has been only 2.5%. The sentiment of the market seems to be neutral for the time being, with the Fear & Greed Index standing at 52. Everyone is still focused on the triangle formation and if BNB will extricate itself from it.
Featured image from Gemini Imagen, chart from TradingView


Read More
![Will Maple Finance [SYRUP] extend rally as TVL hits $2.2B? THESE metrics say…](https://ambcrypto.com/wp-content/uploads/2026/07/IMG_4073-e1783687751868.webp)
Will Maple Finance [SYRUP] extend rally as TVL hits $2.2B? THESE metrics say…