#BTC The multi-week Bitcoin Downtrend is over $BTC #Crypto #Bitcoin


Share:
Predictions Markets
See what traders are focused on


Bitcoin wrapped the week in green, reclaiming the $115,000 mark as traders grew increasingly confident about the possibility of US interest rate cuts.
That optimism spilled across the market, lifting most digital assets and nudging the total crypto market cap back above the $4 trillion threshold, a level it had failed to reclaim since late August.
Investor appetite was also visible in the fear and greed index, which settled at 57, firmly in the “Greed” zone but still softer than last month’s high of 73.
Altcoins joined the rally with most of the top tokens closing the week with solid advances.
From majors like Ethereum and Solana to mid-cap projects, the gains suggested that enthusiasm was not confined to Bitcoin alone.
Bitcoin traded between $110,055 and $116,083 this week, with the rally fueled by a potent mix of macroeconomic data, mounting rate-cut expectations, and a resurgence in institutional inflows.
Early in the week, optimism began to take shape after a weaker-than-expected non-farm payrolls report revealed that just 22,000 jobs were added in August, far short of the 75,000 economists had projected.
Meanwhile, the unemployment rate crept up to 4.3%, breaking out of a 15-month range and further reinforcing the idea that the labor market may be softening faster than anticipated.
These numbers set off fresh speculation that the Federal Reserve may be nearing a pivot toward more accommodative policy, sparking a bullish mood across risk assets.
By mid-week, that narrative only gained steam. The Bureau of Labor Statistics released updated Producer Price Index (PPI) figures showing that headline PPI fell sharply from a 0.7% increase in July to a 0.1% decline in August, bringing the annual rate down to 2.8%.
Core PPI, which strips out food and energy, also eased to 2.6% year-over-year, reinforcing the idea that inflationary pressure is cooling faster than expected.
Those hopes were tempered slightly on September 11 when the Consumer Price Index (CPI) came in a touch hotter than anticipated.
CPI rose 0.4% month-over-month in August, against expectations of a 0.3% increase, with annual inflation rising to 2.9%.
Core CPI held steady at a 3.1% annual rate, matching forecasts.
Still, the overall tone from investors remained upbeat, especially after jobless claims spiked to 263,000, the highest level since October 2021, suggesting more slack in the labor market.
Beyond macro signals, Bitcoin’s move higher was reinforced by clear signs of institutional demand.
After a brief lull early in the week, capital inflows returned with force.
According to data from SoSoValue, spot Bitcoin ETFs saw more than $1.7 billion in net inflows before Friday’s close, marking the strongest weekly performance in nearly two months.
Wednesday alone accounted for nearly $800 million of that total, underlining the renewed appetite for Bitcoin among larger investors.
That surge coincided with Bitcoin reclaiming the $114,000 level, a key psychological threshold last touched in late August, and the rally also gained strength after a positive earnings report from Oracle Corporation (ORCL), a major player in artificial intelligence infrastructure.
Further backing the rally was on-chain activity. Data from CryptoQuant showed that so-called “conviction-driven” holders snapped up more than 65,000 BTC in just seven days, capitalising on the price dip that began in August.
These “sharks”, typically wallets holding between 100 and 1,000 BTC, seemed to have interpreted the recent market lull as a buying opportunity rather than a warning sign.
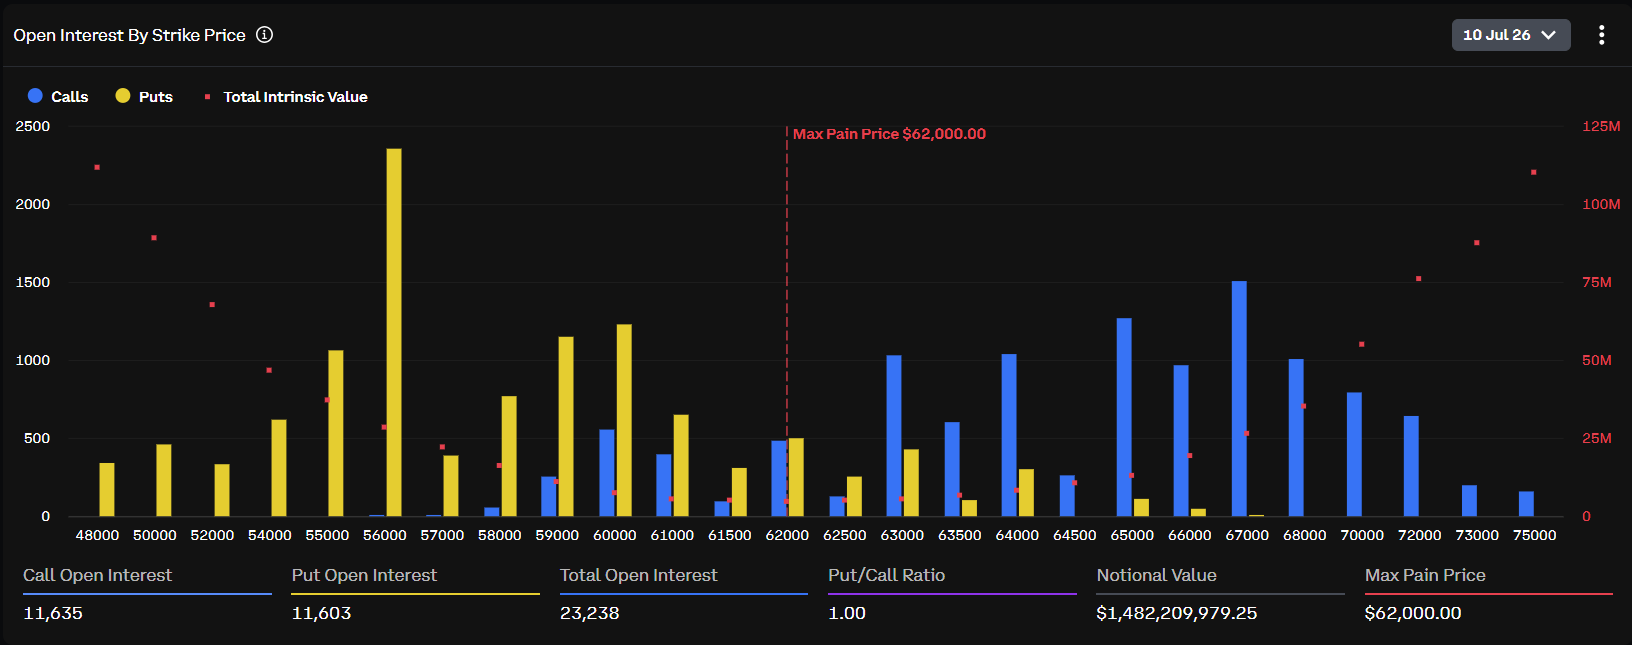
Another telltale sign of demand came from the derivatives market, where longer-term bets became more apparent this week as open interest surged in Bitcoin options, with December 2025 calls leading the charge.
When gauging Bitcoin’s upcoming price trajectory, analysts at Glassnode drew attention to open interest data, which continues to show a clear bias toward calls over puts, “highlighting a market that leans bullish while still managing downside risk,” the firm noted.
They further added that both futures basis and options positioning appear more balanced than in previous overheated phases, suggesting that the current advance may be unfolding on firmer footing.
That interpretation aligns with a surge in overall options open interest, which climbed to a record $54.6 billion, a 26% jump from $43 billion at the start of September.
Notably, when OI last approached this level in mid-August, Bitcoin was simultaneously making fresh all-time highs above $124,500.
While current price action remains slightly below that peak, the recurrence of heavy OI alongside a bullish structure adds weight to the idea that a significant upside move could be in play once again.
Meanwhile, some analysts were also watching a $4.3 billion options expiry on Friday that could serve as a short-term catalyst.
Much of the open interest is stacked in bullish positions, and as long as Bitcoin holds above $113,000, a key level for max pain, bulls may retain the upper hand.
If the price maintains altitude through expiry, the door opens for a potential leg up toward $120,000.
Supporting that scenario is the weekly Binance BTC/USDT liquidation heatmap, which adds valuable context on where traders are most exposed.

BTC 1-week liquidation heatmap. Source: Coinglass.
The chart shows a particularly intense band of short liquidations clustered between $113,000 and $114,000, indicating that a sharp squeeze occurred as Bitcoin powered through this region earlier in the week.
That burst of forced closures likely amplified upward momentum, as liquidated shorts fueled a cascade effect common during breakout rallies.
Below current levels, the most substantial liquidation clusters are now concentrated slightly lower, between $110,000 and $111,000, forming a broader, firmer support base should Bitcoin correct.
These zones may attract dip buyers or re-entry from sidelined traders, offering some cushion in case of short-term pullbacks.
On the flip side, while the area between $115,000 and $117,000 shows moderate liquidation buildup, the levels above $117,000 remain relatively thin.
That lack of defensive positioning creates a potential “fast zone,” where price could accelerate quickly toward $120,000, especially if momentum aligns with favorable options flow and continued ETF demand.
For the rally to continue, crypto analyst Ted Pillows said BTC needs to decisively reclaim the $117,200 level, a price zone that not only acts as horizontal resistance but also aligns with an unfilled CME futures gap.

BTC/USDT 1-D price chart. Source: Ted Pillows on X.
However, he also cautioned that if Bitcoin fails to hold recent gains, a rejection from that region could send prices back to retest the monthly lows around $105,000.
Adding to the bullish narrative, Bitcoin had also broken out of a multi-week downtrend, according to fellow analyst Rekt Capital, who pointed to a clean break above a descending resistance line on the daily chart.
Meanwhile, pseudonymous market commentator Crypto King was more assertive in his outlook.
Referencing a repeating chart structure supported by MACD crossovers and breakout patterns, he argued that Bitcoin could be entering its third major impulse rally of the year.
BTC/USDT 1-D price chart. Source: Crypto king on X.
If the setup plays out as it did during the last two cycles, Crypto King believes BTC could be on track to breach $130,000 in the coming weeks, which would mark a new all-time high for the flagship crypto.
At press time, BTC was holding steady near the $115,500 mark, up roughly 5% in the past 7 days.
The total market capitalization of all altcoins increased by 8.3% over the past seven days to $1.83 trillion at press time.
This comes as market sentiment toward altcoins has turned bullish once again, with analysts speculating that an altcoin season may be approaching soon, especially as the Altcoin Season Index has climbed to 67 from 29 last month.
However, it should be noted that a full altcoin season is typically confirmed when the index reading surpasses 75.
Ethereum (ETH), the leading altcoin by market share, rose 5.7% during the period as momentum picked up later in the week, pushing the price back above the $4,500 threshold.
Meanwhile, Solana (SOL), Hyperliquid (HYPE), and Dogecoin (DOGE) delivered better performances, rising 17%, 18%, and 22%, respectively.
MYX Finance (MYX) was the leading gainer this week among the top 100 altcoins, surging 1,280% and massively outpacing other tokens. Worldcoin (WLD) and MemeCore (M) followed with more modest gains, rising 76% and 38%, respectively.

Source: CoinMarketCap
MYX Finance: MYX rallied to its all-time high this week, largely fueled by its listing on crypto exchange Gate.
Listings on such a major exchange often trigger renewed community discussion surrounding the related token, which in turn builds investor demand for it.
The token also drew investor attention after the decentralized perpetual exchange revealed that it would list the WLFI token, associated with US President Donald Trump and his family.
However, some traders within the community were seen speculating that the rally may have been driven by price manipulation by whales and insiders.
Worldcoin: WLD’s price took off this week after Eightco, a company backed by Bitmine Immersion, launched a $250 million WLD treasury bet.
Meanwhile, an uptick in Whale buying added to the buying pressure.
Last week, World switched to the Anonymized Multi-Party Computation protocol, which promises to enhance the World network’s biometric verification process by upping security and privacy.
Protocol upgrades are always bullish in a trader’s handbook, and it has helped support WLD’s rally in recent sessions.
MemeCore: Traders started stacking M early in the week at a renewed pace after MemeCore officially launched its EVM-compatible Layer-1 blockchain.
The new blockchain will reportedly provide a structured framework designed to reduce volatility and curb short-term speculation typically observed in the meme coin market.
Subsequently, M went live across spot markets on crypto exchange Gate, which added to the momentum already brewing due to the mainnet launch.
The post Bitcoin price reclaims $115K on rate cut optimism, MYX outperforms with 1200% surge appeared first on Invezz
Coins
$ 64.16K
-0.25%$ 1.82K
+0.40%$ 0.99932
+0.02%$ 0.00731
-0.72%$ 0.0737
-1.87%Predictions Markets
See what traders are focused on
Share:
Coins
$ 64.16K
-0.25%$ 1.82K
+0.40%$ 0.99932
+0.02%$ 0.00731
-0.72%$ 0.0737
-1.87%Predictions Markets
See what traders are focused on
Share:
Read More