Ethereum Price Prediction: Is $1.5K or $2K Next for ETH?
Share:
Ethereum is attempting to recover after defending the $1.5K region but is approaching a major confluence resistance that will decide if the move becomes a larger trend reversal or remains a short relief rally. The daily chart is bearish: ETH trades below a descending long-term trendline and both the 100-day and 200-day moving averages are sloping lower, signaling sellers still control the market and continued downside risk for crypto, DeFi and token performance.
Predictions Markets
See what traders are focused on

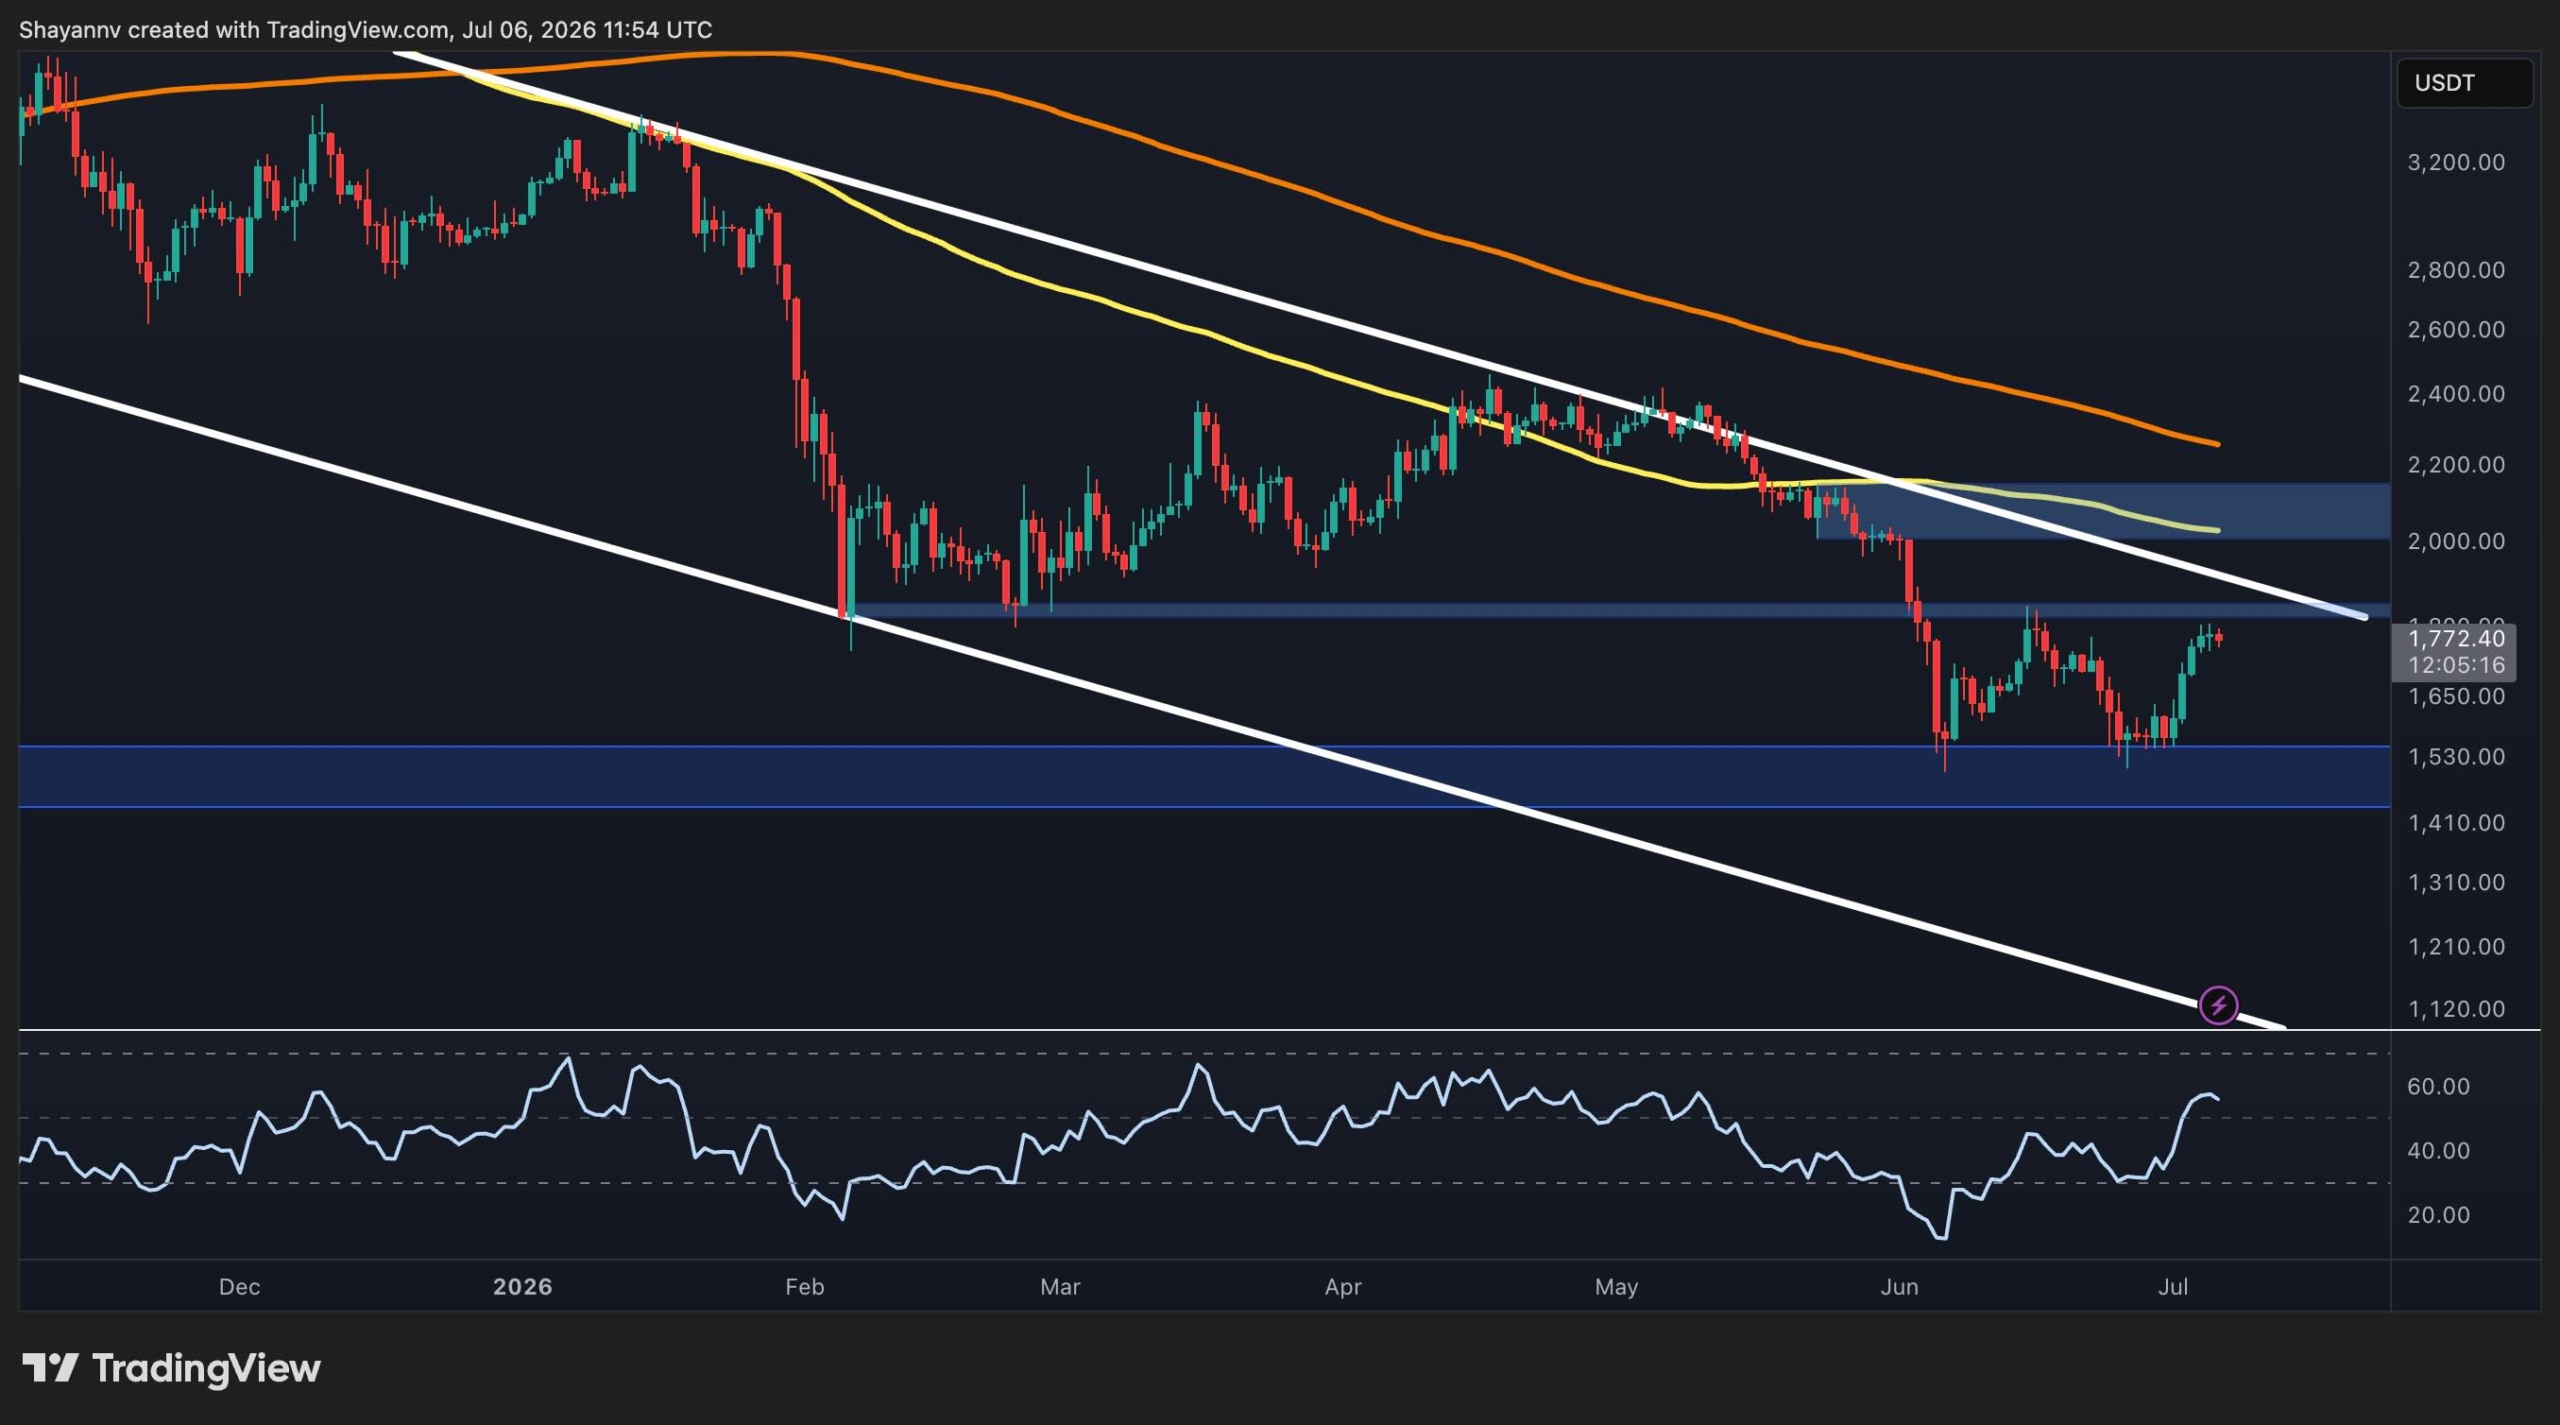
Ethereum is attempting to recover after defending the $1.5K region once more, but the broader trend remains under pressure. The price is now approaching a major confluence resistance area that could determine whether this rebound develops into a larger trend reversal or remains another relief rally within the prevailing downtrend.
Ethereum Price Analysis: The Daily Chart
The daily chart continues to reflect a bearish market structure. ETH remains below the descending long-term trendline, as well as the 100-day and 200-day moving averages, all of which continue to slope lower. This alignment suggests sellers still maintain control from a broader perspective.
In This News
Coins

$ 1.81K
+1.29%
$ 1.81K
+1.23%Predictions Markets
See what traders are focused on
Share:
In This News
Coins
$ 1.81K
+1.29%$ 1.81K
+1.23%Predictions Markets
See what traders are focused on
Share:
Read More
Ethereum Price Analysis: ETH Faces a Crucial Test After Latest Rebound