Bitcoin Price Flashes Major Buy Signal On The 4-Hour TD Sequential Chart, Where To Enter?
Share:
Predictions Markets
See what traders are focused on

A crypto analyst has shared a TD Sequential chart indicating that the Bitcoin price is flashing a major buy signal in the 4-hour time frame. This signal suggests that Bitcoin’s bearish momentum could be waning, making this a potentially critical moment to consider entering the market.
Bitcoin Price TD Sequential Flashes Buy Signal
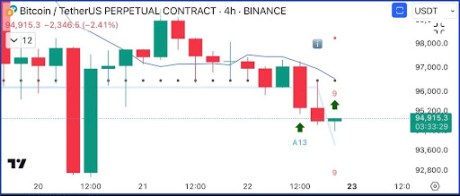
A TD Sequential is a unique technical indicator that identifies trend exhaustion and price reversals and indicates buy or sell signals. According to an X (formerly Twitter) post by crypto analyst Ali Martinez, Bitcoin’s 4-hour chart showcases a green “9” candle, signaling a potential buying opportunity.
Typically, in a downtrend, the green 9 candle is interpreted as a buy signal, indicating that bearish momentum might be reaching exhaustion and prices could be getting ready for a rebound. Martinez also shows an ”A13” marker on the TD Sequential chart, which represents a countdown phase that tracks 13 additional candles and identifies a stronger trend exhaustion.
During a downtrend, the appearance of a TD Sequential A13 often signals a potential decline in a cryptocurrency’s sell-off phase, reinforcing the possibility of a price reversal. Bitcoin’s current buy signal emerged as its price exceeded $94,000. This buy signal suggests an optimal time to enter the market, with the $94,915 price point highlighted as a potential entry for traders aiming to capitalize on a possible Bitcoin price rebound.
Although the TD Sequential is an indicator used to identify buy and sell signals, market participants can exercise caution by considering additional factors like volatility, broader market sentiment, and more. If the current buy signal holds, Martinez has predicted that a price rebound can be expected. However, a failure to maintain its current price could lead to further downsides, potentially pushing Bitcoin to its next critical support level.
BTC Market Top Set At $168,500
In another more recent X post, Martinez presented a chart of Bitcoin’s price movements, predicting a market top above $168,500 based on the Mayer Multiple. The chart shows Bitcoin price performance based on the Mayer Multiple, which compares BTC to the 200-day Moving Average (MA).
The red line, as seen on the chart, indicates the Mayer MultipLe (MM) at 2.4, while the green line showcases MM at 0.8. Additionally, the blue line is the Oscillator, which tracks the Mayer Multiple over time.

Historically, the Bitcoin price tops have coincided with the Mayer Multiple reaching the 2.4 level or higher. Currently, Bitcoin’s Multiple Mayer sits at 1.3845 in the chart. However, if its price continues to rise and the MM reaches 2.4 again, Martinez predicts a market top above $168,500 for Bitcoin.
As of writing, Bitcoin’s price is $94,692, meaning a surge to $168,500 would require a significant 78% increase from its present market value.


Read More

Bitcoin Mining Difficulty Falls 5% to 127.17T