GBP/USD Price Forecast: Downside Resumes After Triangle Breakdown Test
Share:
GBP/USD resumed a bearish breakout after a symmetrical triangle failed as support, with 1.2650–1.2670 now acting as resistance, immediate support at 1.2580 and downside targets toward 1.2500–1.2450 while a stop above 1.2720 is suggested for shorts. The pair trades below the 50 and 200 EMAs and RSI is under 40, indicating building selling momentum that could accelerate on DXY strength or hawkish Fed comments and may spill over into crypto and DeFi markets sensitive to dollar moves.
Predictions Markets
See what traders are focused on

BitcoinWorld
GBP/USD Price Forecast: Downside Resumes After Triangle Breakdown Test
The British pound weakened against the US dollar on Wednesday, with the GBP/USD pair resuming its downward trajectory after briefly testing the breakdown zone of a symmetrical triangle pattern. The move confirms the bearish bias that has dominated the pair in recent sessions, as sellers defend key resistance levels.
Technical Breakdown Confirms Bearish Momentum
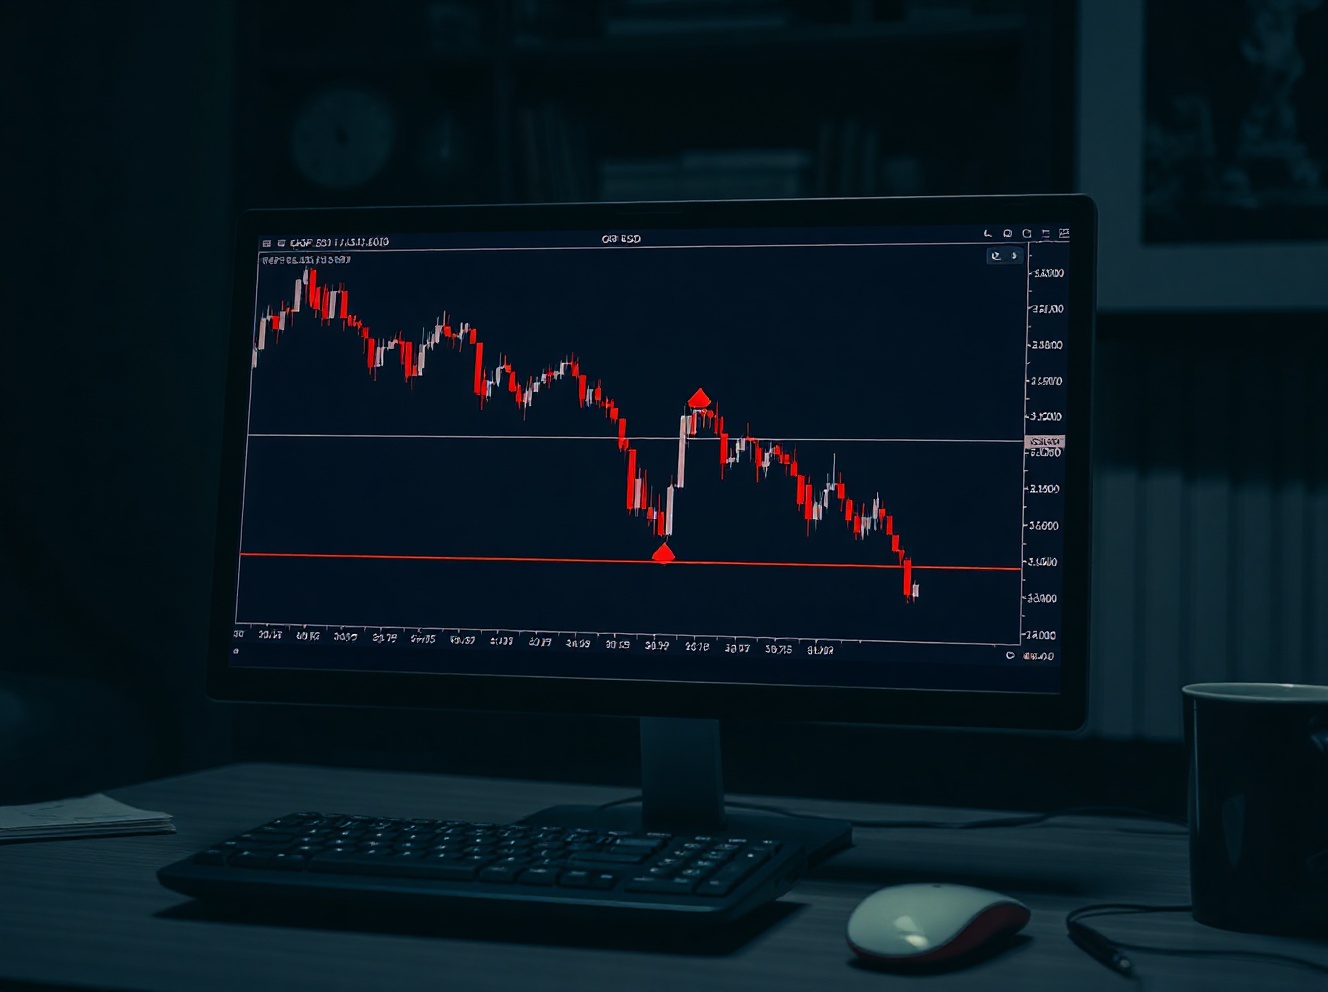
The symmetrical triangle pattern, which had formed over the past two weeks, acted as a consolidation phase before the pair broke lower on Tuesday. The breakdown was followed by a retest of the broken support-turned-resistance zone near the 1.2650 level, which sellers successfully defended. The subsequent decline suggests that the initial breakdown was not a false signal but a genuine shift in momentum.
The 4-hour chart shows the pair trading below the 50-period and 200-period exponential moving averages, reinforcing the bearish outlook. The Relative Strength Index (RSI) has dipped below 40, indicating that bearish momentum is building but not yet in oversold territory, leaving room for further downside.
Key Support and Resistance Levels to Watch
Immediate support lies at the 1.2580 level, the low from last week. A break below this level could open the door for a move toward the 1.2500 psychological barrier. On the upside, the 1.2650–1.2670 zone now serves as strong resistance, followed by the 1.2720 level, which coincides with the triangle’s upper boundary.
Traders should monitor the US dollar index (DXY) for additional clues, as the greenback has strengthened broadly on expectations of further Federal Reserve tightening. Any hawkish comments from Fed officials could accelerate the pair’s decline.
Market Implications for Traders
For short-term traders, the current setup favors selling into rallies toward the 1.2650 resistance zone, with a stop-loss above 1.2720. The measured move target of the triangle breakdown suggests a potential decline toward the 1.2450 area over the coming sessions. However, traders should remain cautious of sudden reversals if US economic data disappoints.
The broader context includes ongoing uncertainty around the Bank of England’s rate path. While the BoE has raised rates aggressively, slowing UK economic data may limit further tightening, which could weigh on the pound in the medium term.
Conclusion
The GBP/USD pair’s downside resumption after testing the triangle breakdown zone reinforces the bearish technical outlook. With key resistance holding and momentum indicators pointing lower, the path of least resistance appears to be to the downside. Traders should watch for a break below 1.2580 for confirmation of the next leg lower.
FAQs
Q1: What is a symmetrical triangle pattern in forex trading?
A symmetrical triangle is a chart pattern characterized by converging trendlines, indicating a period of consolidation before a breakout. The direction of the breakout—up or down—signals the likely next trend.
Q2: Why is the 1.2650 level important for GBP/USD?
The 1.2650 level represents the lower boundary of the triangle pattern that was broken. After a breakdown, this level often acts as resistance, where sellers may re-enter the market.
Q3: What factors could reverse the bearish outlook for GBP/USD?
A surprise dovish shift from the Federal Reserve, stronger-than-expected UK economic data, or a sharp risk-on move in global markets could trigger a reversal. Traders should monitor upcoming US and UK economic releases.
This post GBP/USD Price Forecast: Downside Resumes After Triangle Breakdown Test first appeared on BitcoinWorld.


Read More

USD/CAD Price Forecast: Buyers Keep Control Despite Weakening Bullish Momentum