


Solana (SOL) Aims Higher With Strong Buyer Support, Next Stop $200?
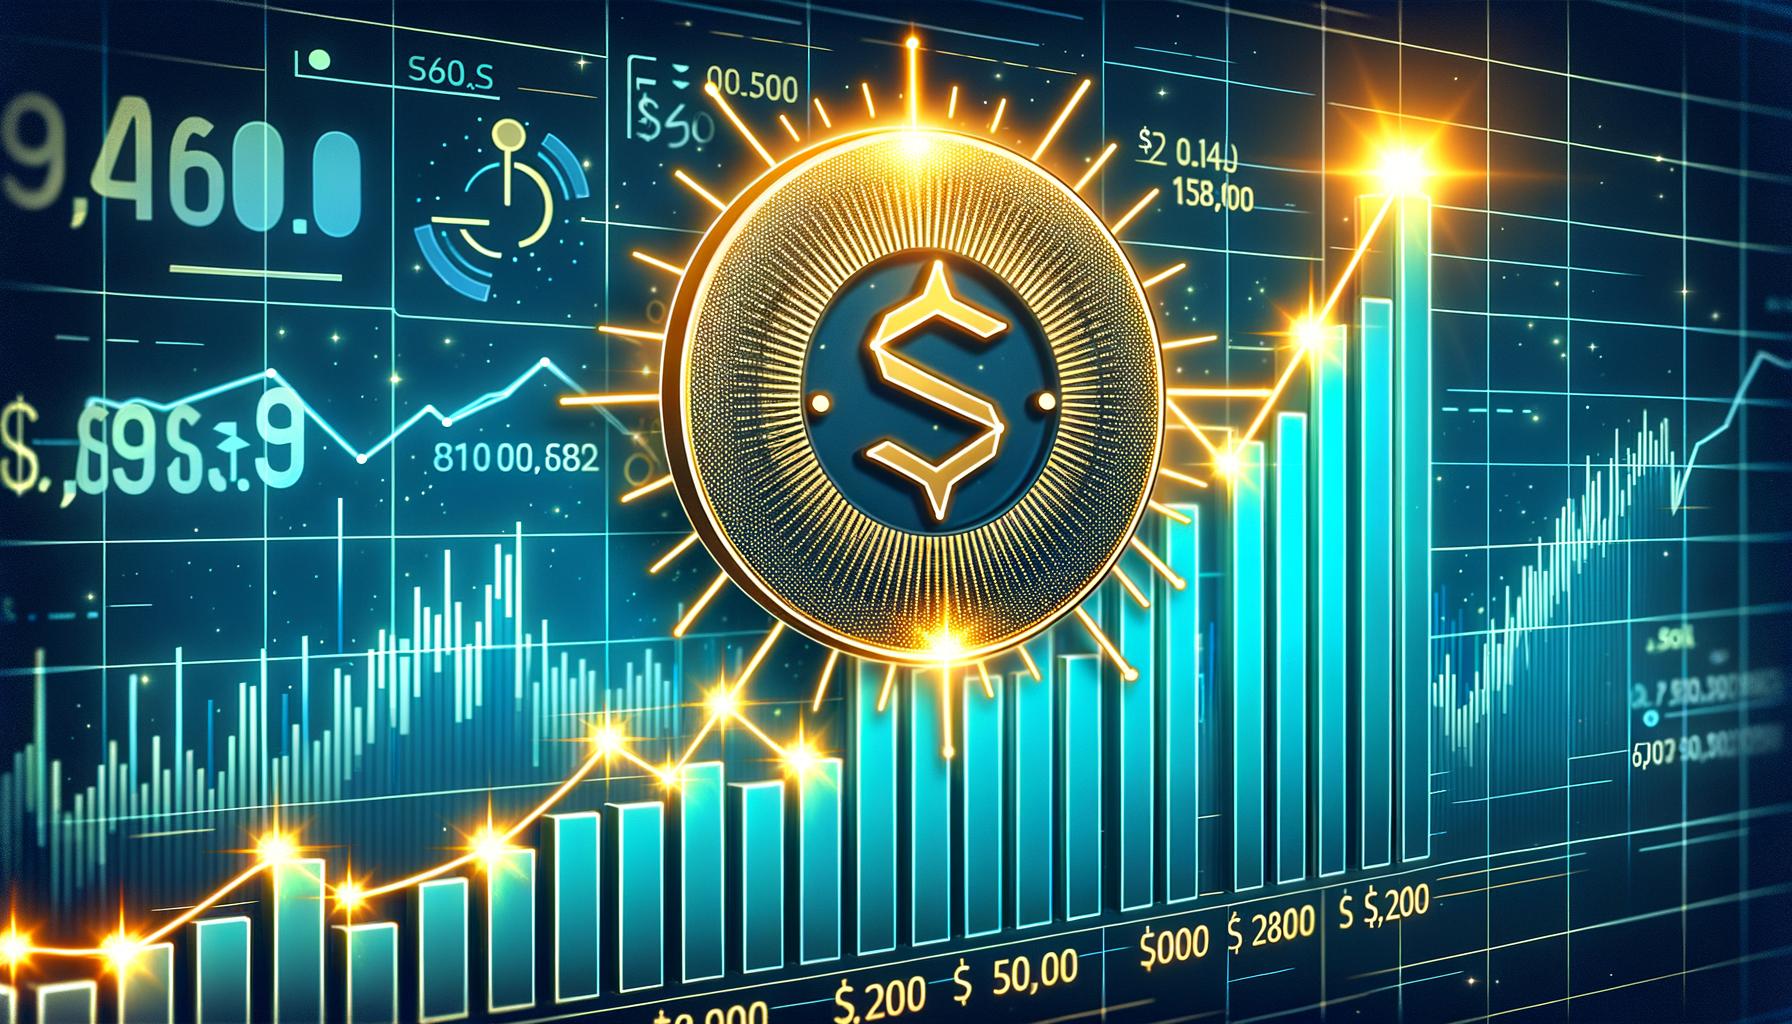
Solana started a fresh increase from the $165 zone. SOL price is now gaining pace and might aim for more gains above the $180 zone.
- SOL price started a fresh increase above the $170 level against the US Dollar.
- The price is now trading above $172 and the 100-hourly simple moving average.
- There is a connecting bullish trend line forming with support at $170 on the hourly chart of the SOL/USD pair (data source from Kraken).
- The pair could start a fresh increase if it clears the $180 resistance zone.
Solana Price Rises Above $172
Solana price formed a base above the $165 support and started a fresh increase, like Bitcoin and Ethereum. SOL gained pace for a move above the $170 and $172 resistance levels.
The bulls even pushed the price above the $175 level. A high was formed at $177.50 and the price is now consolidating gains above the 23.6% Fib retracement level of the recent wave from the $165 swing low to the $177.50 high.
Solana is now trading above $172 and the 100-hourly simple moving average. There is also a connecting bullish trend line forming with support at $170 on the hourly chart of the SOL/USD pair.

On the upside, the price is facing resistance near the $178 level. The next major resistance is near the $180 level. The main resistance could be $185. A successful close above the $185 resistance zone could set the pace for another steady increase. The next key resistance is $192. Any more gains might send the price toward the $200 level.
Another Decline in SOL?
If SOL fails to rise above the $180 resistance, it could start another decline. Initial support on the downside is near the $174.50 zone. The first major support is near the $172 level or the 50% Fib retracement level of the recent wave from the $165 swing low to the $177.50 high.
A break below the $172 level might send the price toward the $170 zone and the trend line. If there is a close below the $170 support, the price could decline toward the $162 support in the near term.
Technical Indicators
Hourly MACD – The MACD for SOL/USD is gaining pace in the bullish zone.
Hourly Hours RSI (Relative Strength Index) – The RSI for SOL/USD is above the 50 level.
Major Support Levels – $172 and $170.
Major Resistance Levels – $178 and $180.
Read More
Solana (SOL) Aims Higher With Strong Buyer Support, Next Stop $200?
Solana started a fresh increase from the $165 zone. SOL price is now gaining pace and might aim for more gains above the $180 zone.
- SOL price started a fresh increase above the $170 level against the US Dollar.
- The price is now trading above $172 and the 100-hourly simple moving average.
- There is a connecting bullish trend line forming with support at $170 on the hourly chart of the SOL/USD pair (data source from Kraken).
- The pair could start a fresh increase if it clears the $180 resistance zone.
Solana Price Rises Above $172
Solana price formed a base above the $165 support and started a fresh increase, like Bitcoin and Ethereum. SOL gained pace for a move above the $170 and $172 resistance levels.
The bulls even pushed the price above the $175 level. A high was formed at $177.50 and the price is now consolidating gains above the 23.6% Fib retracement level of the recent wave from the $165 swing low to the $177.50 high.
Solana is now trading above $172 and the 100-hourly simple moving average. There is also a connecting bullish trend line forming with support at $170 on the hourly chart of the SOL/USD pair.
On the upside, the price is facing resistance near the $178 level. The next major resistance is near the $180 level. The main resistance could be $185. A successful close above the $185 resistance zone could set the pace for another steady increase. The next key resistance is $192. Any more gains might send the price toward the $200 level.
Another Decline in SOL?
If SOL fails to rise above the $180 resistance, it could start another decline. Initial support on the downside is near the $174.50 zone. The first major support is near the $172 level or the 50% Fib retracement level of the recent wave from the $165 swing low to the $177.50 high.
A break below the $172 level might send the price toward the $170 zone and the trend line. If there is a close below the $170 support, the price could decline toward the $162 support in the near term.
Technical Indicators
Hourly MACD – The MACD for SOL/USD is gaining pace in the bullish zone.
Hourly Hours RSI (Relative Strength Index) – The RSI for SOL/USD is above the 50 level.
Major Support Levels – $172 and $170.
Major Resistance Levels – $178 and $180.
Read More