Ethereum Price Analysis: Following a 15% Weekly Crash, What’s Next for ETH?
Share:
Ethereum has once again failed to reclaim the critical $4K resistance level, leading to a notable decline in price. However, the cryptocurrency has now reached a significant support zone, where a rebound followed by consolidation is anticipated.
Technical Analysis
By Shayan
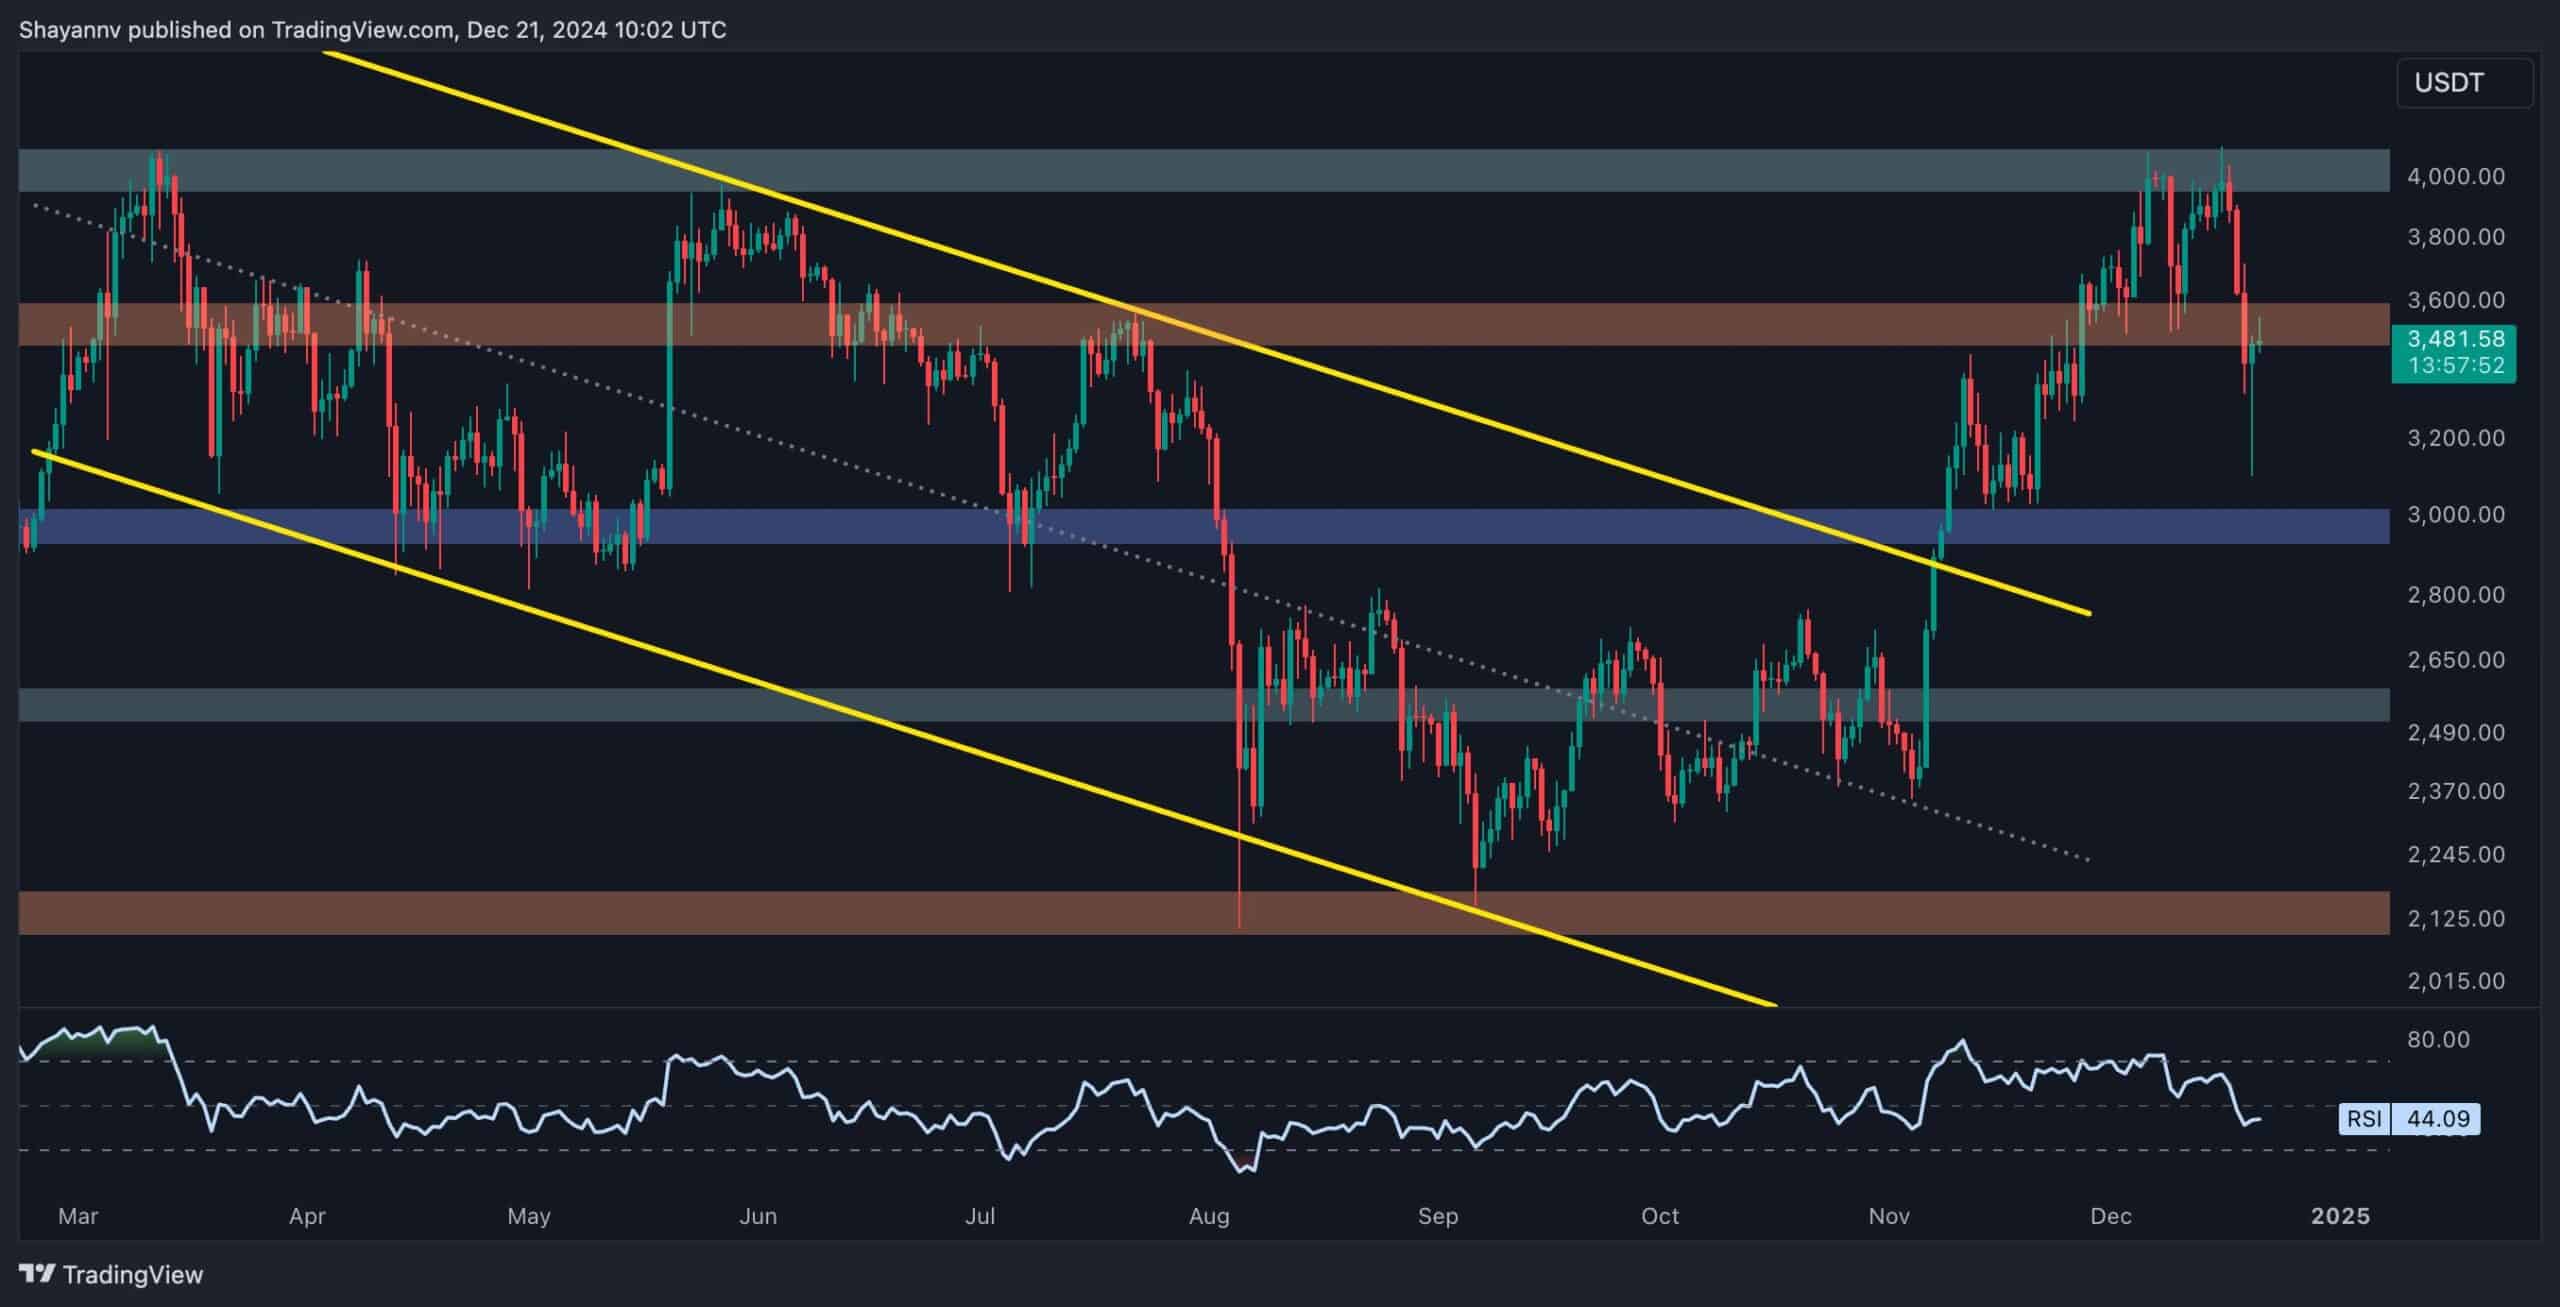
The Daily Chart
Ethereum’s $4K price region has proven to be a critical resistance zone over the past year, consistently halting bullish advances due to strong selling pressure.
Most recently, the price faced another rejection at this level, triggering a significant sell-off. This decline was further fueled by Federal Reserve Chairman Jerome Powell’s remarks, suggesting the central bank might pause its current policy of lowering key interest rates.
Despite this setback, ETH has found support at the $3K level, a crucial price zone, leading to a rebound above the $3.5K threshold. Currently, the cryptocurrency is consolidating within the $3.5K–$4K range, with expectations of a potential bullish attempt to retest the $4K resistance following this consolidation phase.
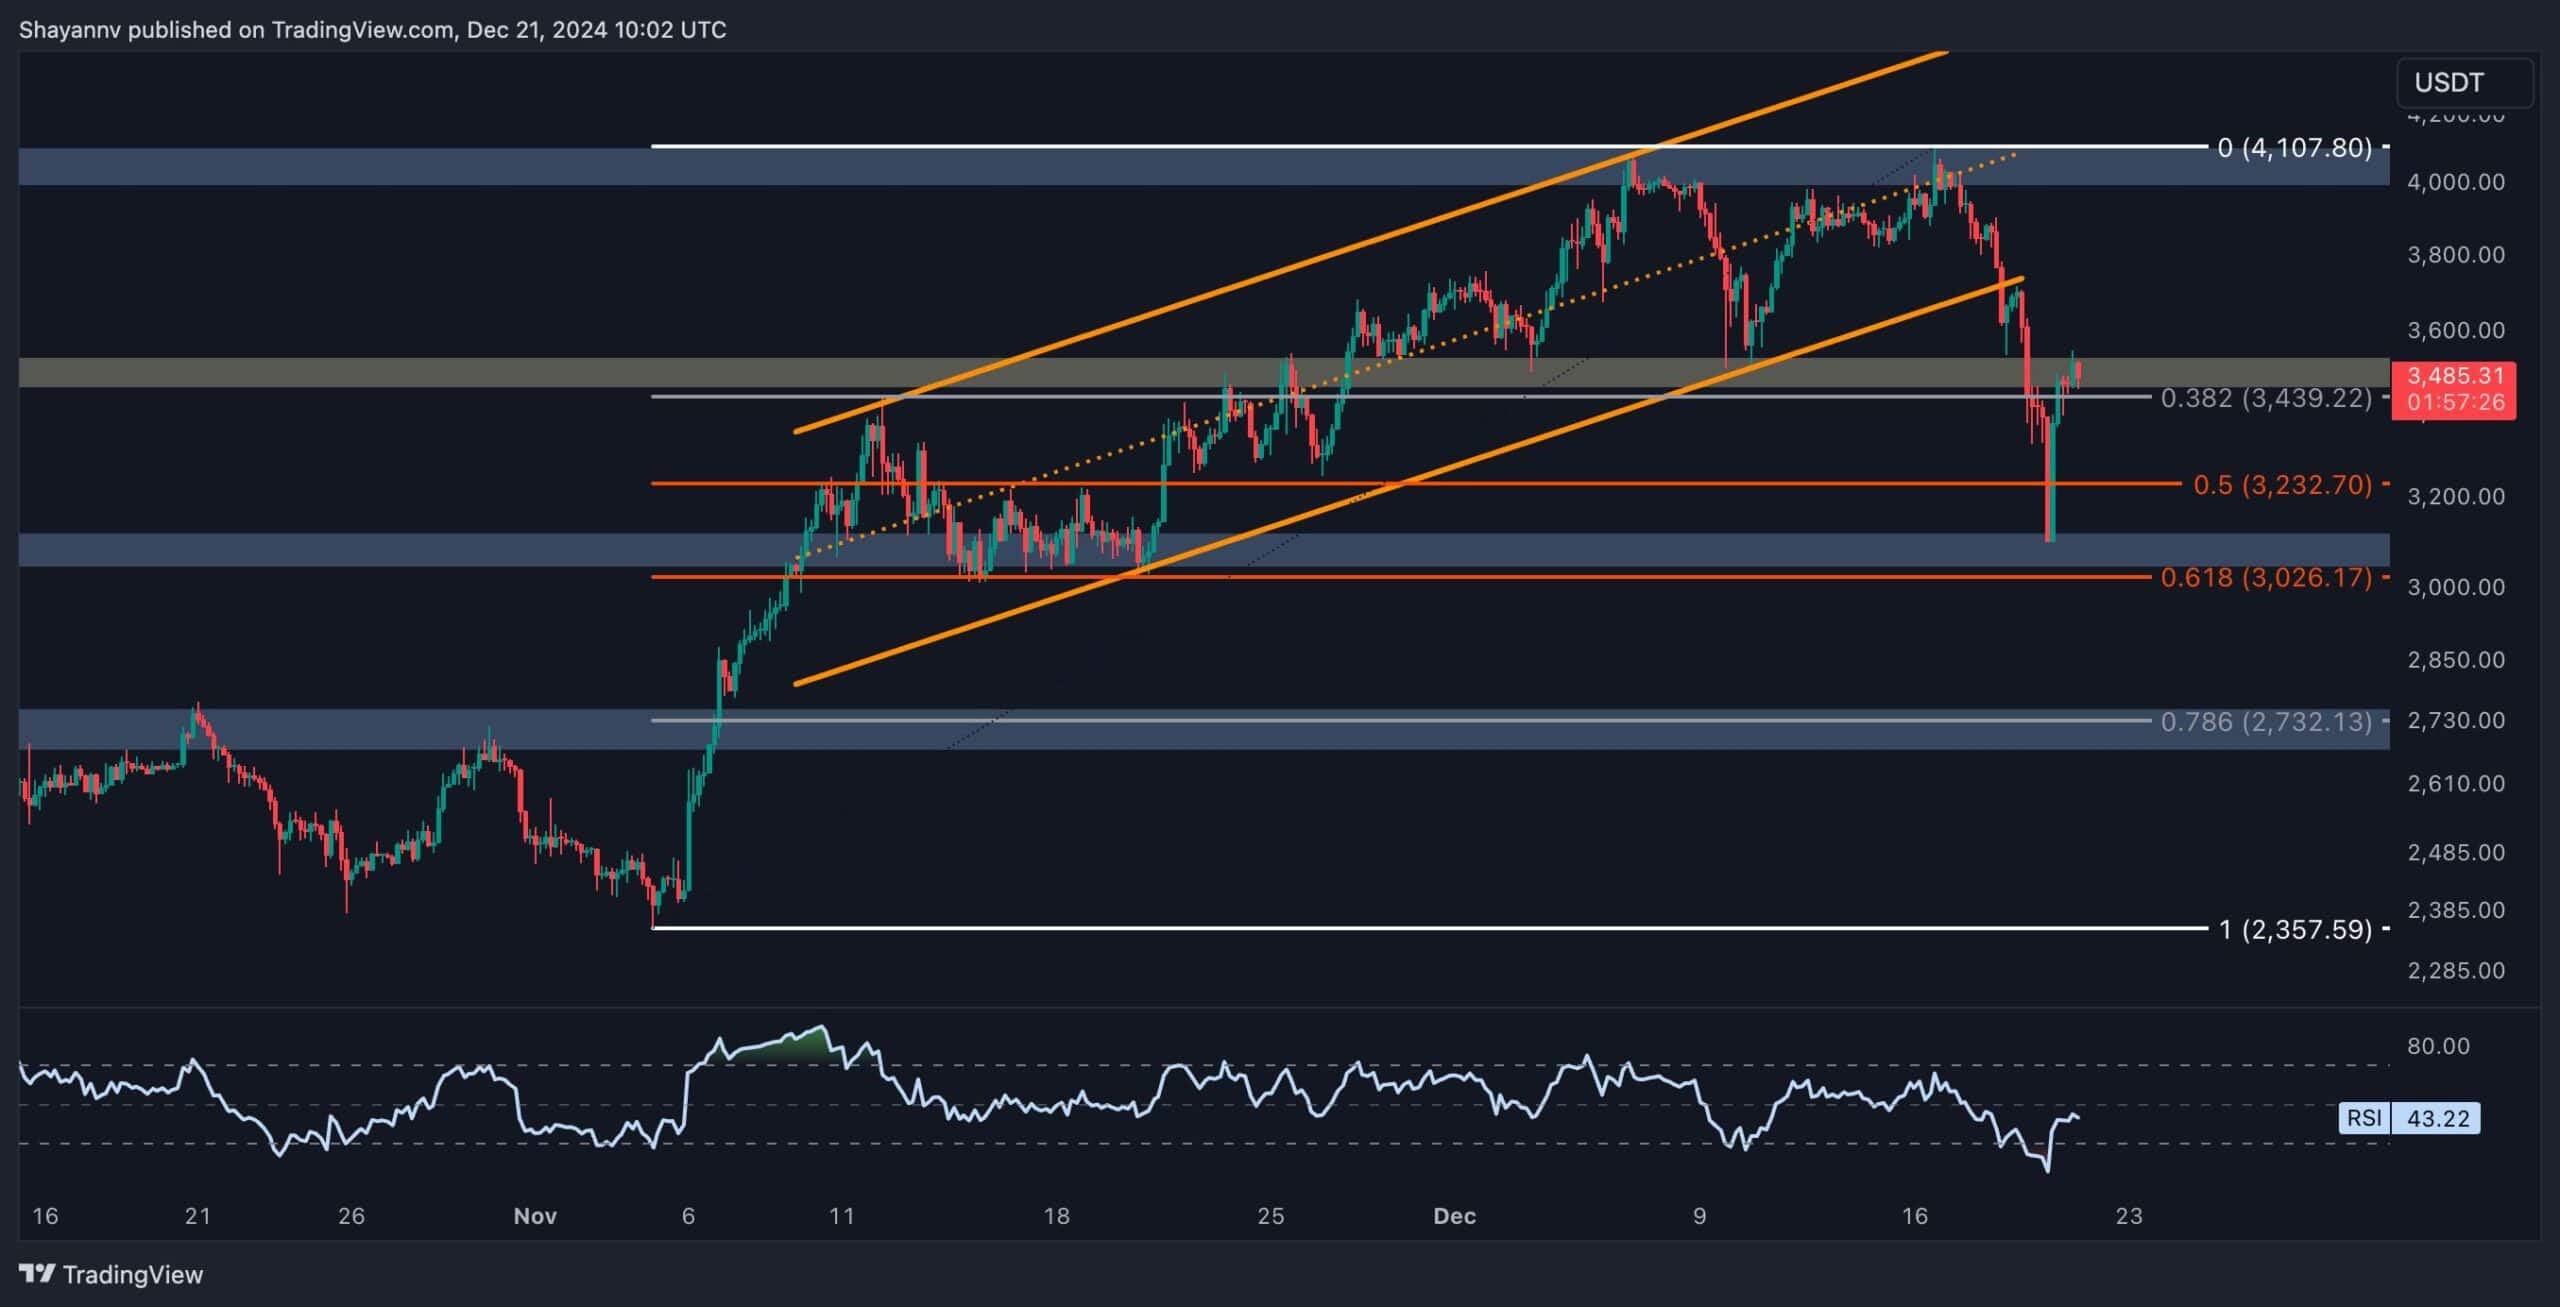
The 4-Hour Chart
On the 4-hour chart, Ethereum’s rejection at the $4K resistance triggered a sharp decline, breaking below the ascending wedge pattern—a clear indication of sellers’ dominance. This bearish momentum pushed the price lower, leading to a pullback before resuming its downtrend.
At present, Ethereum is trading within a significant support zone, defined by the 0.5 ($3.2K)–0.618 ($3K) Fibonacci retracement levels.
This is expected to provide stability in the short to mid-term, with the likelihood of continued consolidation and minor retracements. If this support holds, buyers may re-enter the market, setting the stage for another attempt to challenge the $4K resistance.
Onchain Analysis
By Shayan
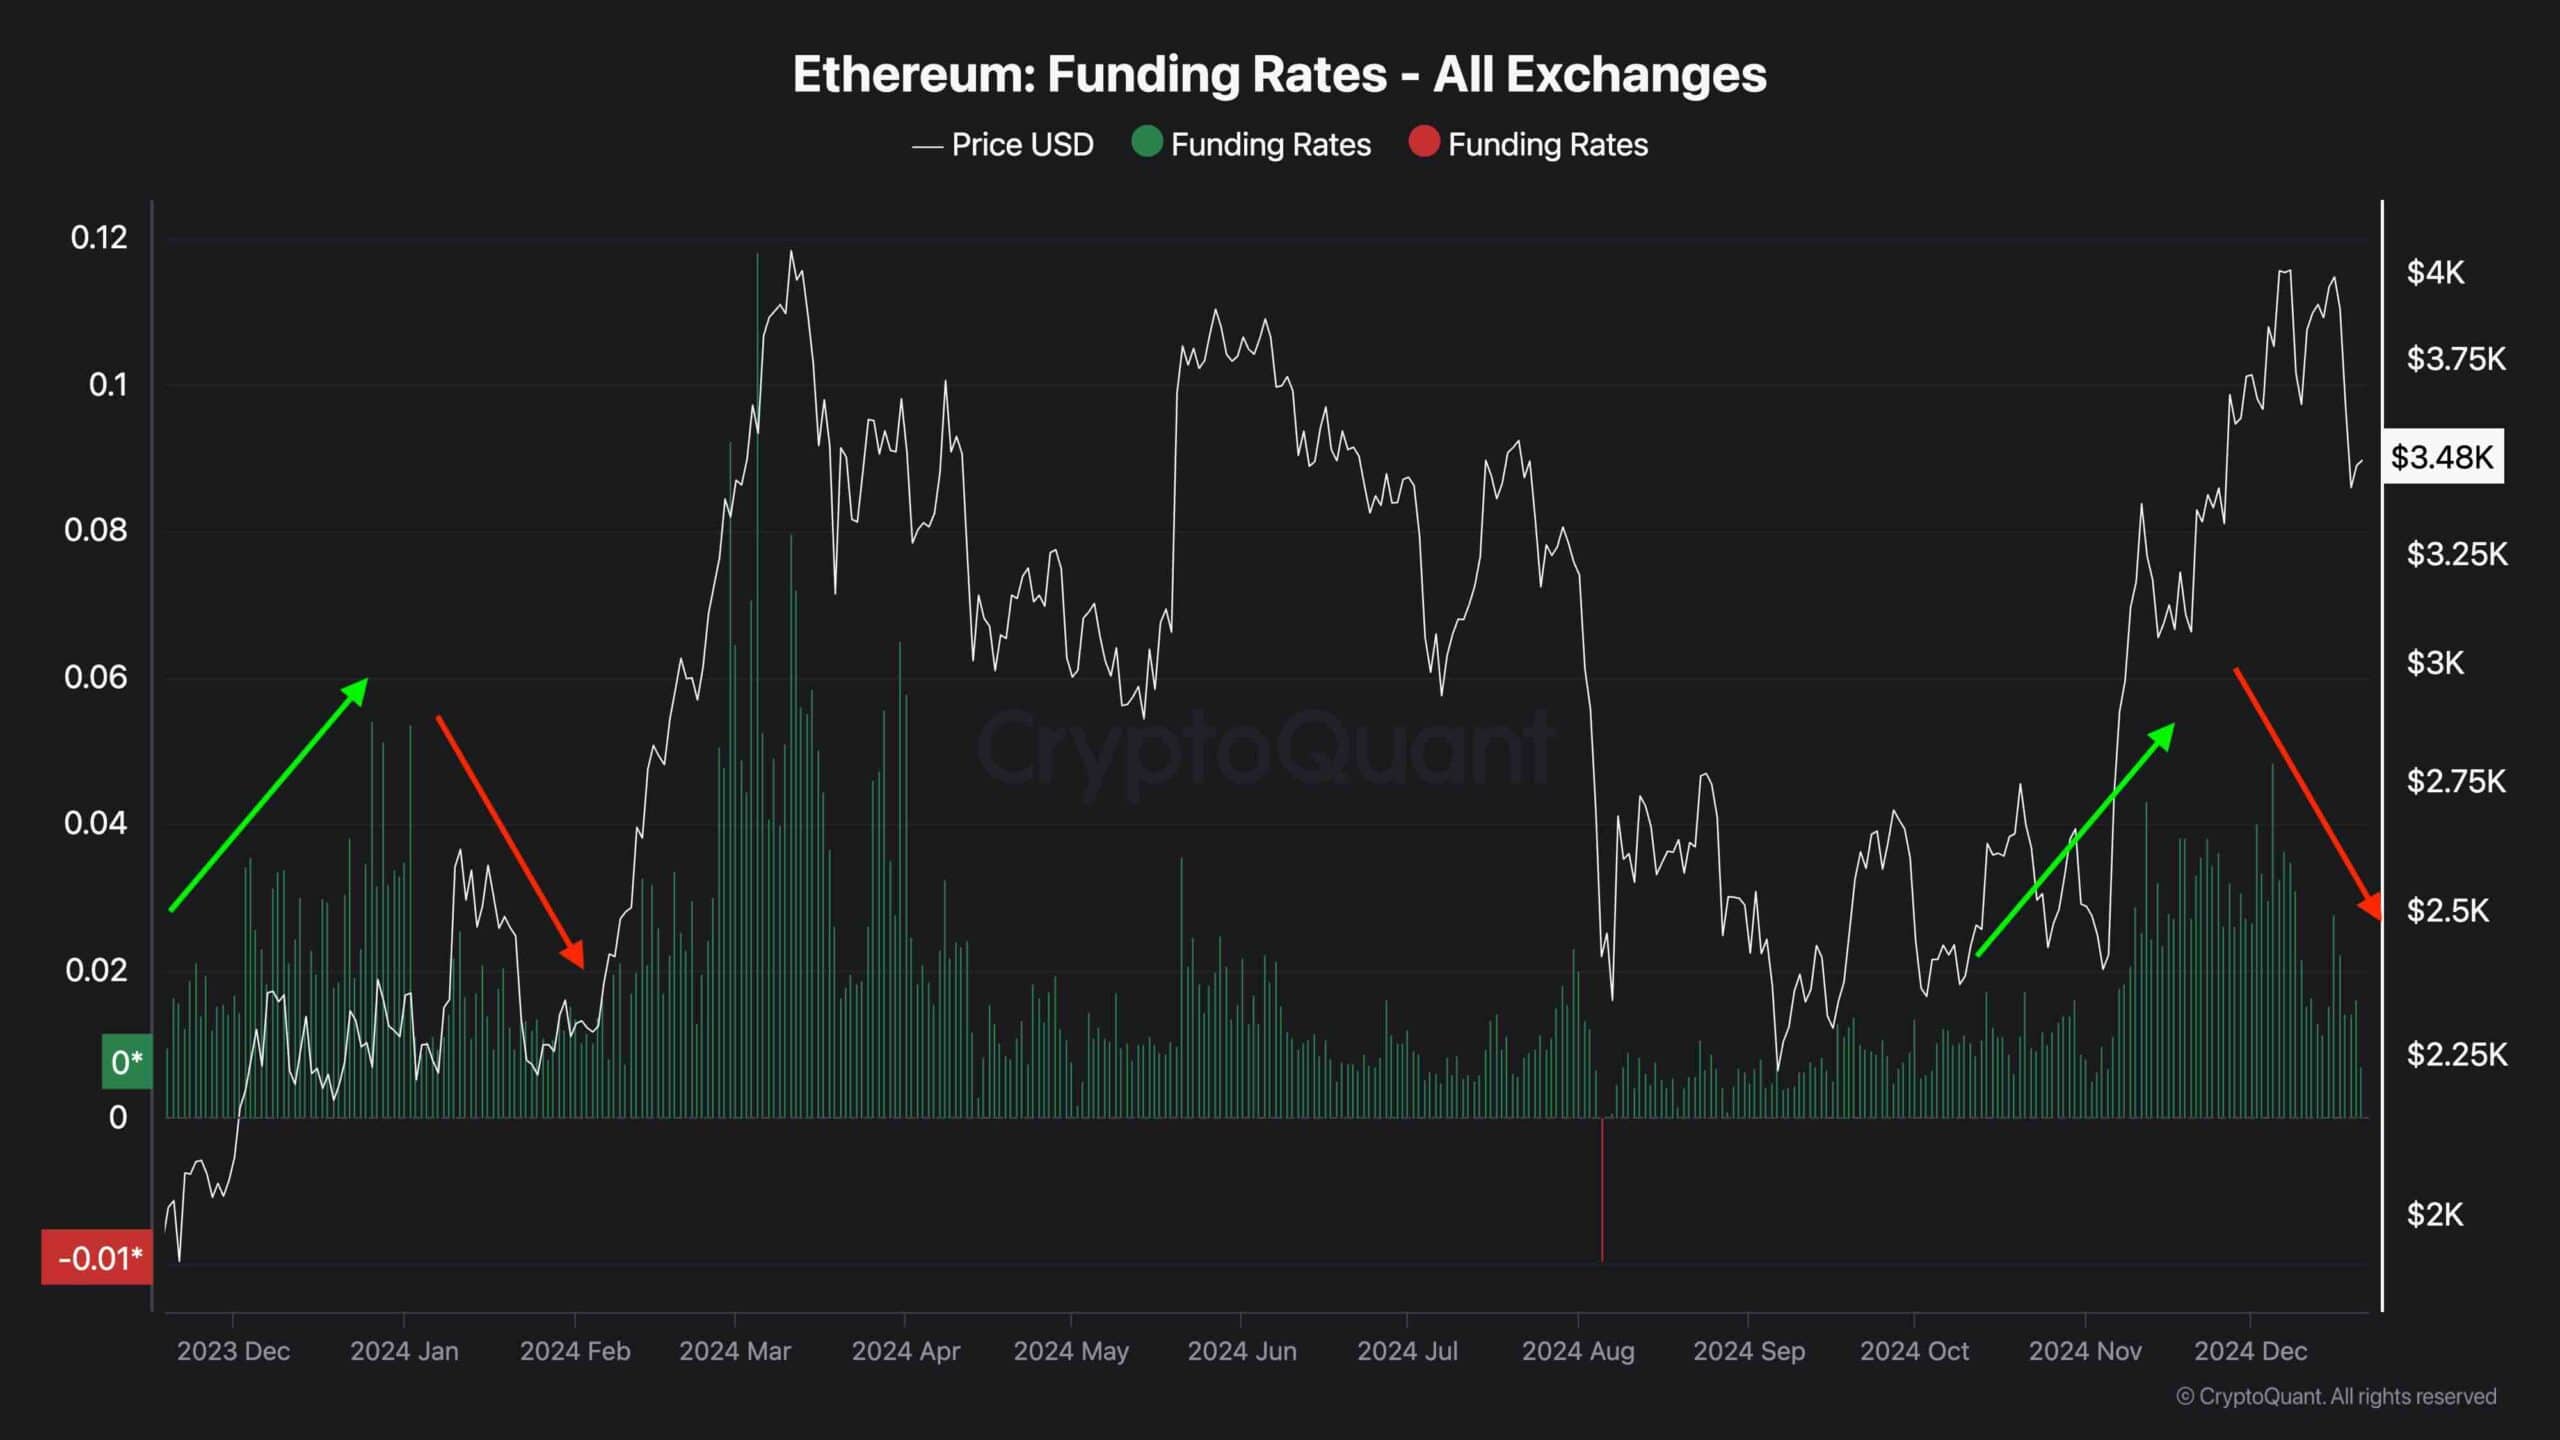
Ethereum’s failure to reclaim the $4K threshold triggered significant liquidations in the futures market, followed by a flash crash that appears to have substantially cooled the broader sentiment.
The chart illustrates the funding rates metric, a reliable indicator of futures market sentiment. While Ethereum’s aggregate funding rates saw a sharp spike last week, the rejection at $4K led to substantial liquidations, bringing funding rates back to levels conducive to a bullish trend.
This cooling effect could pave the way for a more sustainable rally in the coming weeks. A similar pattern was observed in January 2024 when a sharp decline in funding rates calmed the futures market, setting the stage for Ethereum’s next major impulsive rally. This historical precedent suggests that the current market reset could mark the beginning of another bullish phase.
The post Ethereum Price Analysis: Following a 15% Weekly Crash, What’s Next for ETH? appeared first on CryptoPotato.
In This News
Coins


Share:
In This News
Coins
Share:
Read More

Ethereum Price Rally Hits Wall at $2,150 After Explosive 15% Move

Ethereum Price Rebound Pauses at $1,950, Traders Eye Next Move
Ethereum Price Analysis: Following a 15% Weekly Crash, What’s Next for ETH?
Share:
Ethereum has once again failed to reclaim the critical $4K resistance level, leading to a notable decline in price. However, the cryptocurrency has now reached a significant support zone, where a rebound followed by consolidation is anticipated.
Technical Analysis
By Shayan
The Daily Chart
Ethereum’s $4K price region has proven to be a critical resistance zone over the past year, consistently halting bullish advances due to strong selling pressure.
Most recently, the price faced another rejection at this level, triggering a significant sell-off. This decline was further fueled by Federal Reserve Chairman Jerome Powell’s remarks, suggesting the central bank might pause its current policy of lowering key interest rates.
Despite this setback, ETH has found support at the $3K level, a crucial price zone, leading to a rebound above the $3.5K threshold. Currently, the cryptocurrency is consolidating within the $3.5K–$4K range, with expectations of a potential bullish attempt to retest the $4K resistance following this consolidation phase.
The 4-Hour Chart
On the 4-hour chart, Ethereum’s rejection at the $4K resistance triggered a sharp decline, breaking below the ascending wedge pattern—a clear indication of sellers’ dominance. This bearish momentum pushed the price lower, leading to a pullback before resuming its downtrend.
At present, Ethereum is trading within a significant support zone, defined by the 0.5 ($3.2K)–0.618 ($3K) Fibonacci retracement levels.
This is expected to provide stability in the short to mid-term, with the likelihood of continued consolidation and minor retracements. If this support holds, buyers may re-enter the market, setting the stage for another attempt to challenge the $4K resistance.
Onchain Analysis
By Shayan
Ethereum’s failure to reclaim the $4K threshold triggered significant liquidations in the futures market, followed by a flash crash that appears to have substantially cooled the broader sentiment.
The chart illustrates the funding rates metric, a reliable indicator of futures market sentiment. While Ethereum’s aggregate funding rates saw a sharp spike last week, the rejection at $4K led to substantial liquidations, bringing funding rates back to levels conducive to a bullish trend.
This cooling effect could pave the way for a more sustainable rally in the coming weeks. A similar pattern was observed in January 2024 when a sharp decline in funding rates calmed the futures market, setting the stage for Ethereum’s next major impulsive rally. This historical precedent suggests that the current market reset could mark the beginning of another bullish phase.
The post Ethereum Price Analysis: Following a 15% Weekly Crash, What’s Next for ETH? appeared first on CryptoPotato.
In This News
Coins
Share:
In This News
Coins
Share:
Read More
Ethereum Price Rally Hits Wall at $2,150 After Explosive 15% Move