Why Is Pi Network (PI) Crashing Today?

Share:
Predictions Markets
See what traders are focused on

- Pi Network (PI) falls 7.06% to $0.9322, market cap of $6.3B.
- Trading near the lower band, indicating high selling pressure.
Pi Network (PI) has extended its downward trend, dropping 7.06% in the last 24 hours to $0.9322. Its market cap stands at $6.3 billion, reflecting the same percentage decline, while 24-hour trading volume surged 57.46% to $303.63 million, indicating increased market activity.
Despite a broader crypto market recovery, PI struggles to regain lost ground. The token has dropped nearly 60% from its previous highs, raising concerns among investors. Technical indicators suggest further downside pressure unless buying momentum strengthens.
Can Pi Network Recover?
PI faces immediate resistance at $1.00. A breakout above this could push the price toward $1.20, a key psychological level. However, the support at $0.90 remains crucial. If this level is breached, PI could drop further to $0.80 or lower.
The RSI stands at 37.93, nearing oversold conditions. Typically, an RSI below 30 indicates extreme overselling, which could trigger a short-term bounce. However, the RSI moving average is at 39.61, confirming weak buying pressure. Unless the RSI moves above 50, a sustained recovery is unlikely.
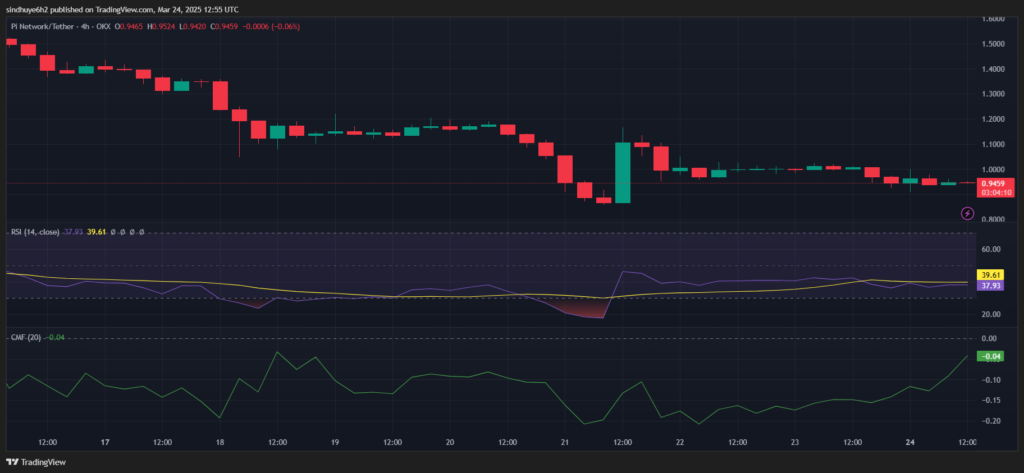
CMF is at -0.04, indicating weak capital inflows. A positive CMF reading would suggest renewed investor confidence, but the current negative value reflects ongoing outflows. If CMF drops further, it could confirm bearish dominance.
PI’s price is moving near the lower Bollinger Band, a sign of high selling pressure. If the bands expand, volatility could increase, leading to sharper price swings. A move toward the middle band would indicate stabilization.
The BBTrend indicator remains negative, reinforcing the bearish outlook. To reverse this trend, PI must reclaim the $1.00 resistance level with strong volume support. Until then, downside risks remain high. A recovery depends on reclaiming key resistance levels and improving market sentiment. If buyers fail to step in, PI could continue its downward trajectory toward $0.80 or lower.
Highlighted Crypto News Today
Metaplanet’s Bitcoin Holdings Reach $291M, Now Holds 3,350 BTC


Read More

Pi Network (PI) Under Pressure After a 9% Drop: Can Buyers Regain Control?