


Is the Ethereum Bull Market Back or is Another Dip Below $3K Imminent? (ETH Price Analysis)
Ethereum’s price is yet to continue its uptrend following a rejection from the $4,000 resistance level. But the bulls are now showing signs of strength, perhaps staging a more considerable recovery.
Technical Analysis
By TradingRage
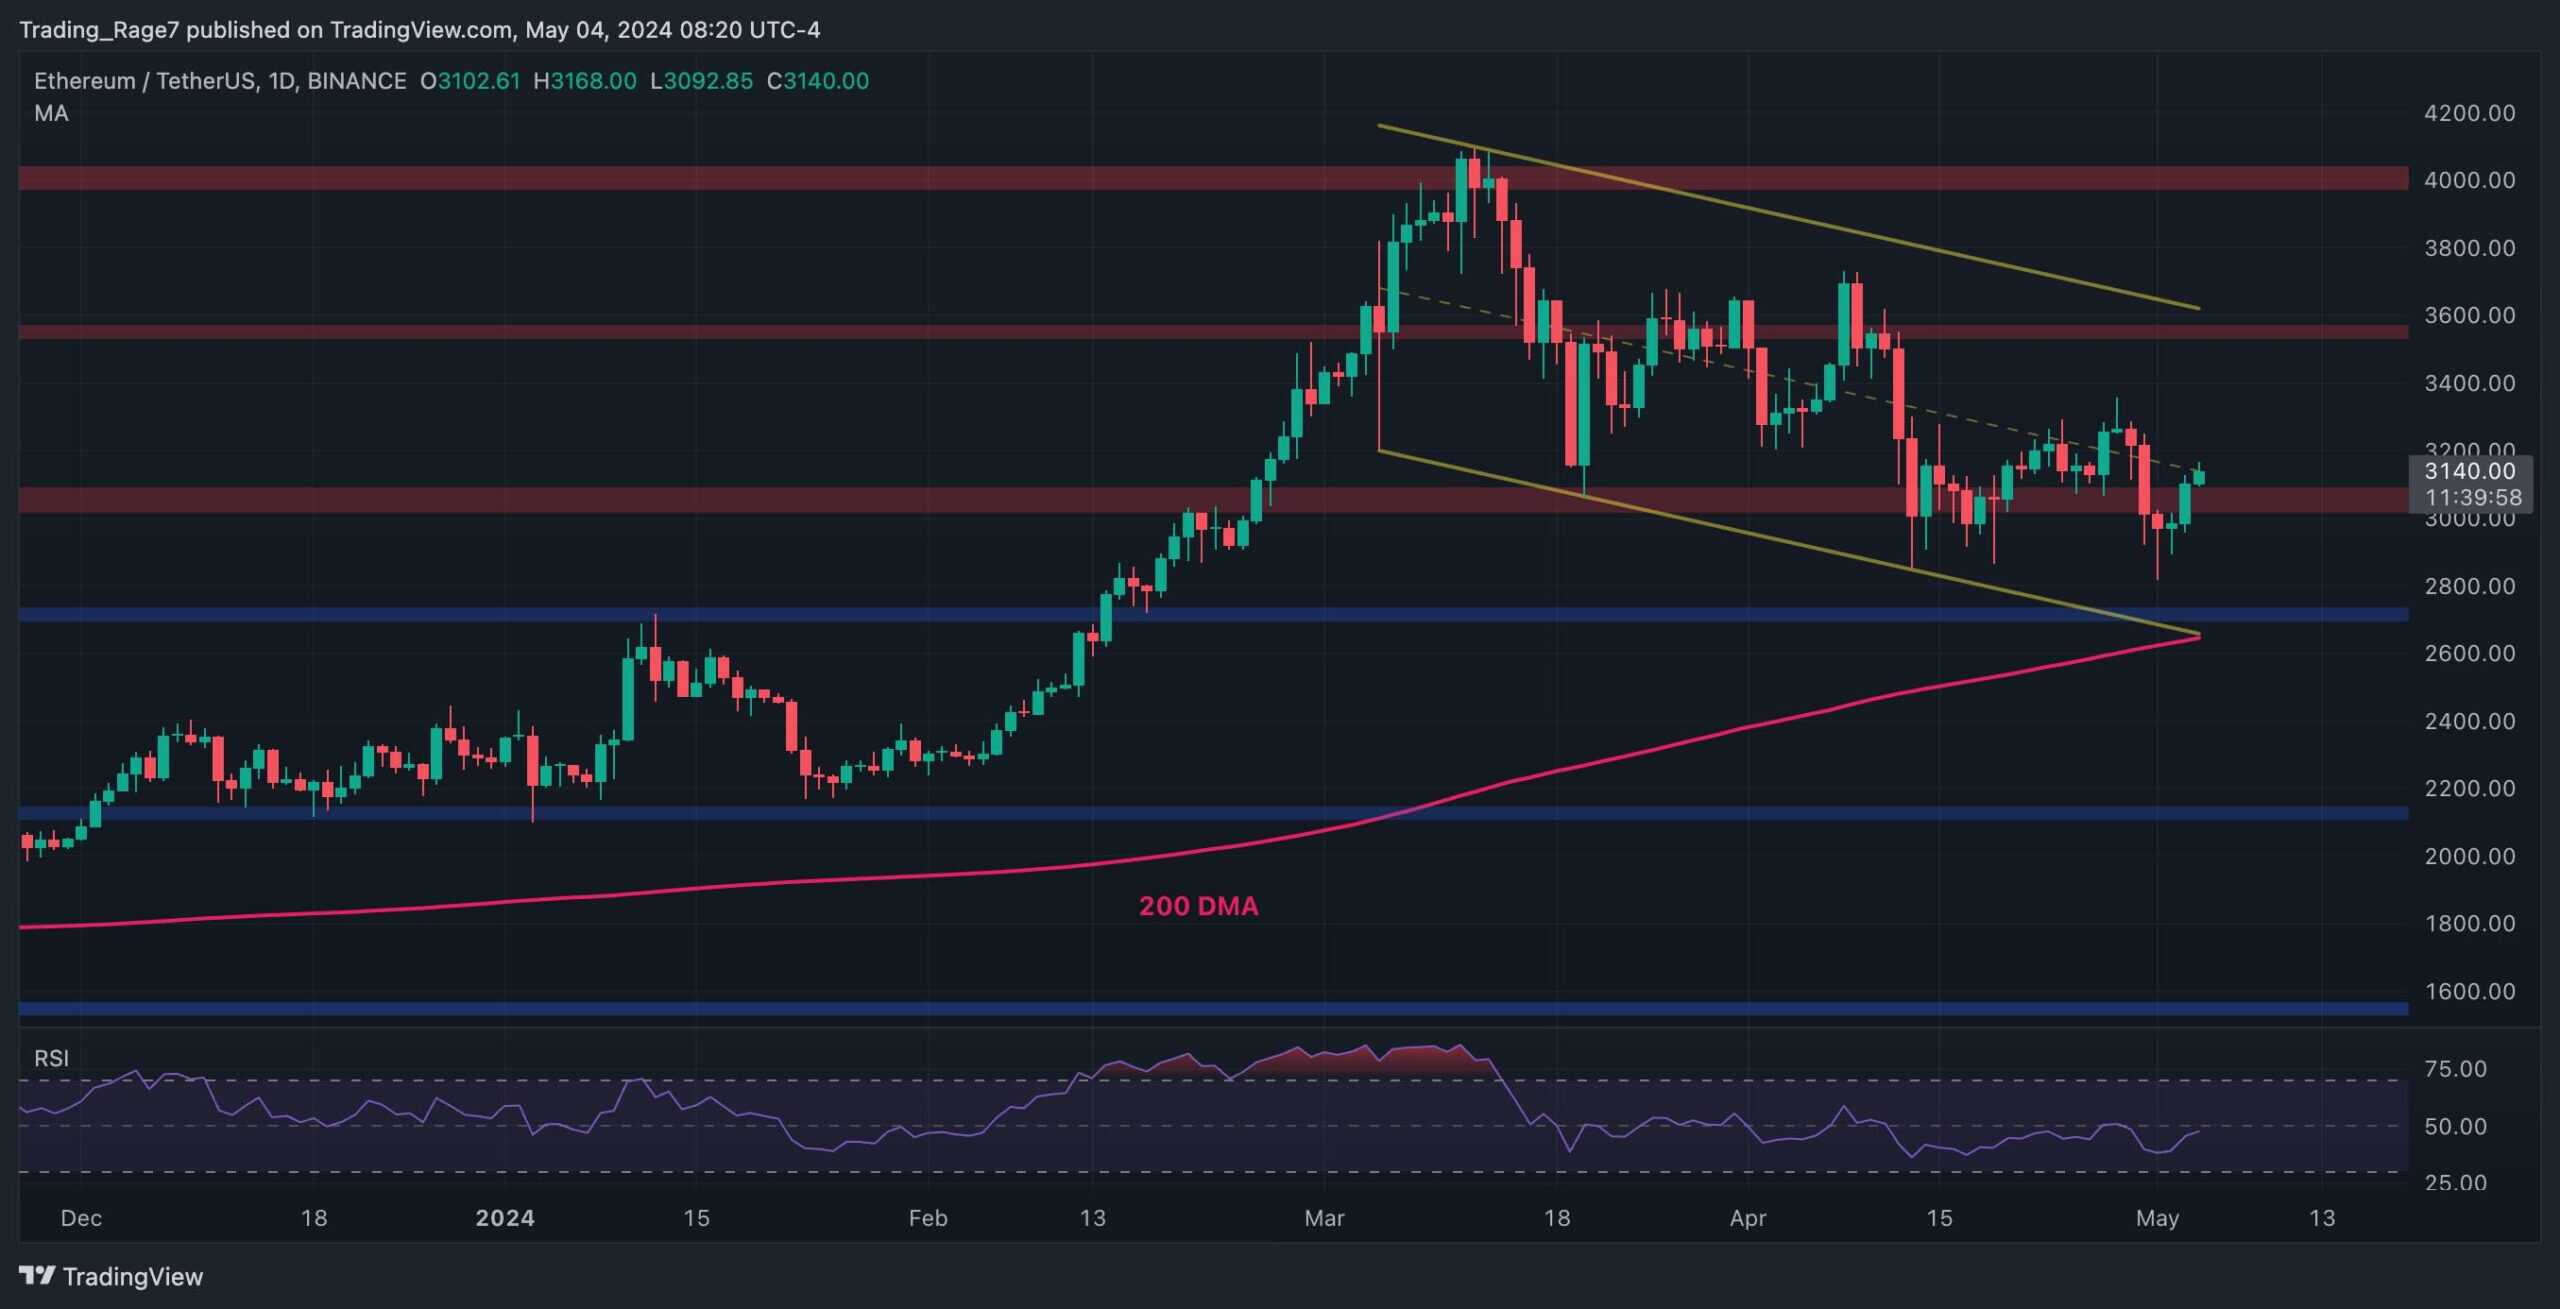
The Daily Chart
As the daily chart depicts, Ethereum’s price has been making lower highs and lows inside a descending channel since failing to break above the $4,000 resistance level.
Yet, the cryptocurrency is climbing back above the $3,000 level and the midline of the channel. If the market successfully recovers back to these levels, a breakout above the channel and a continuation toward $4,000 and even higher prices can be expected.
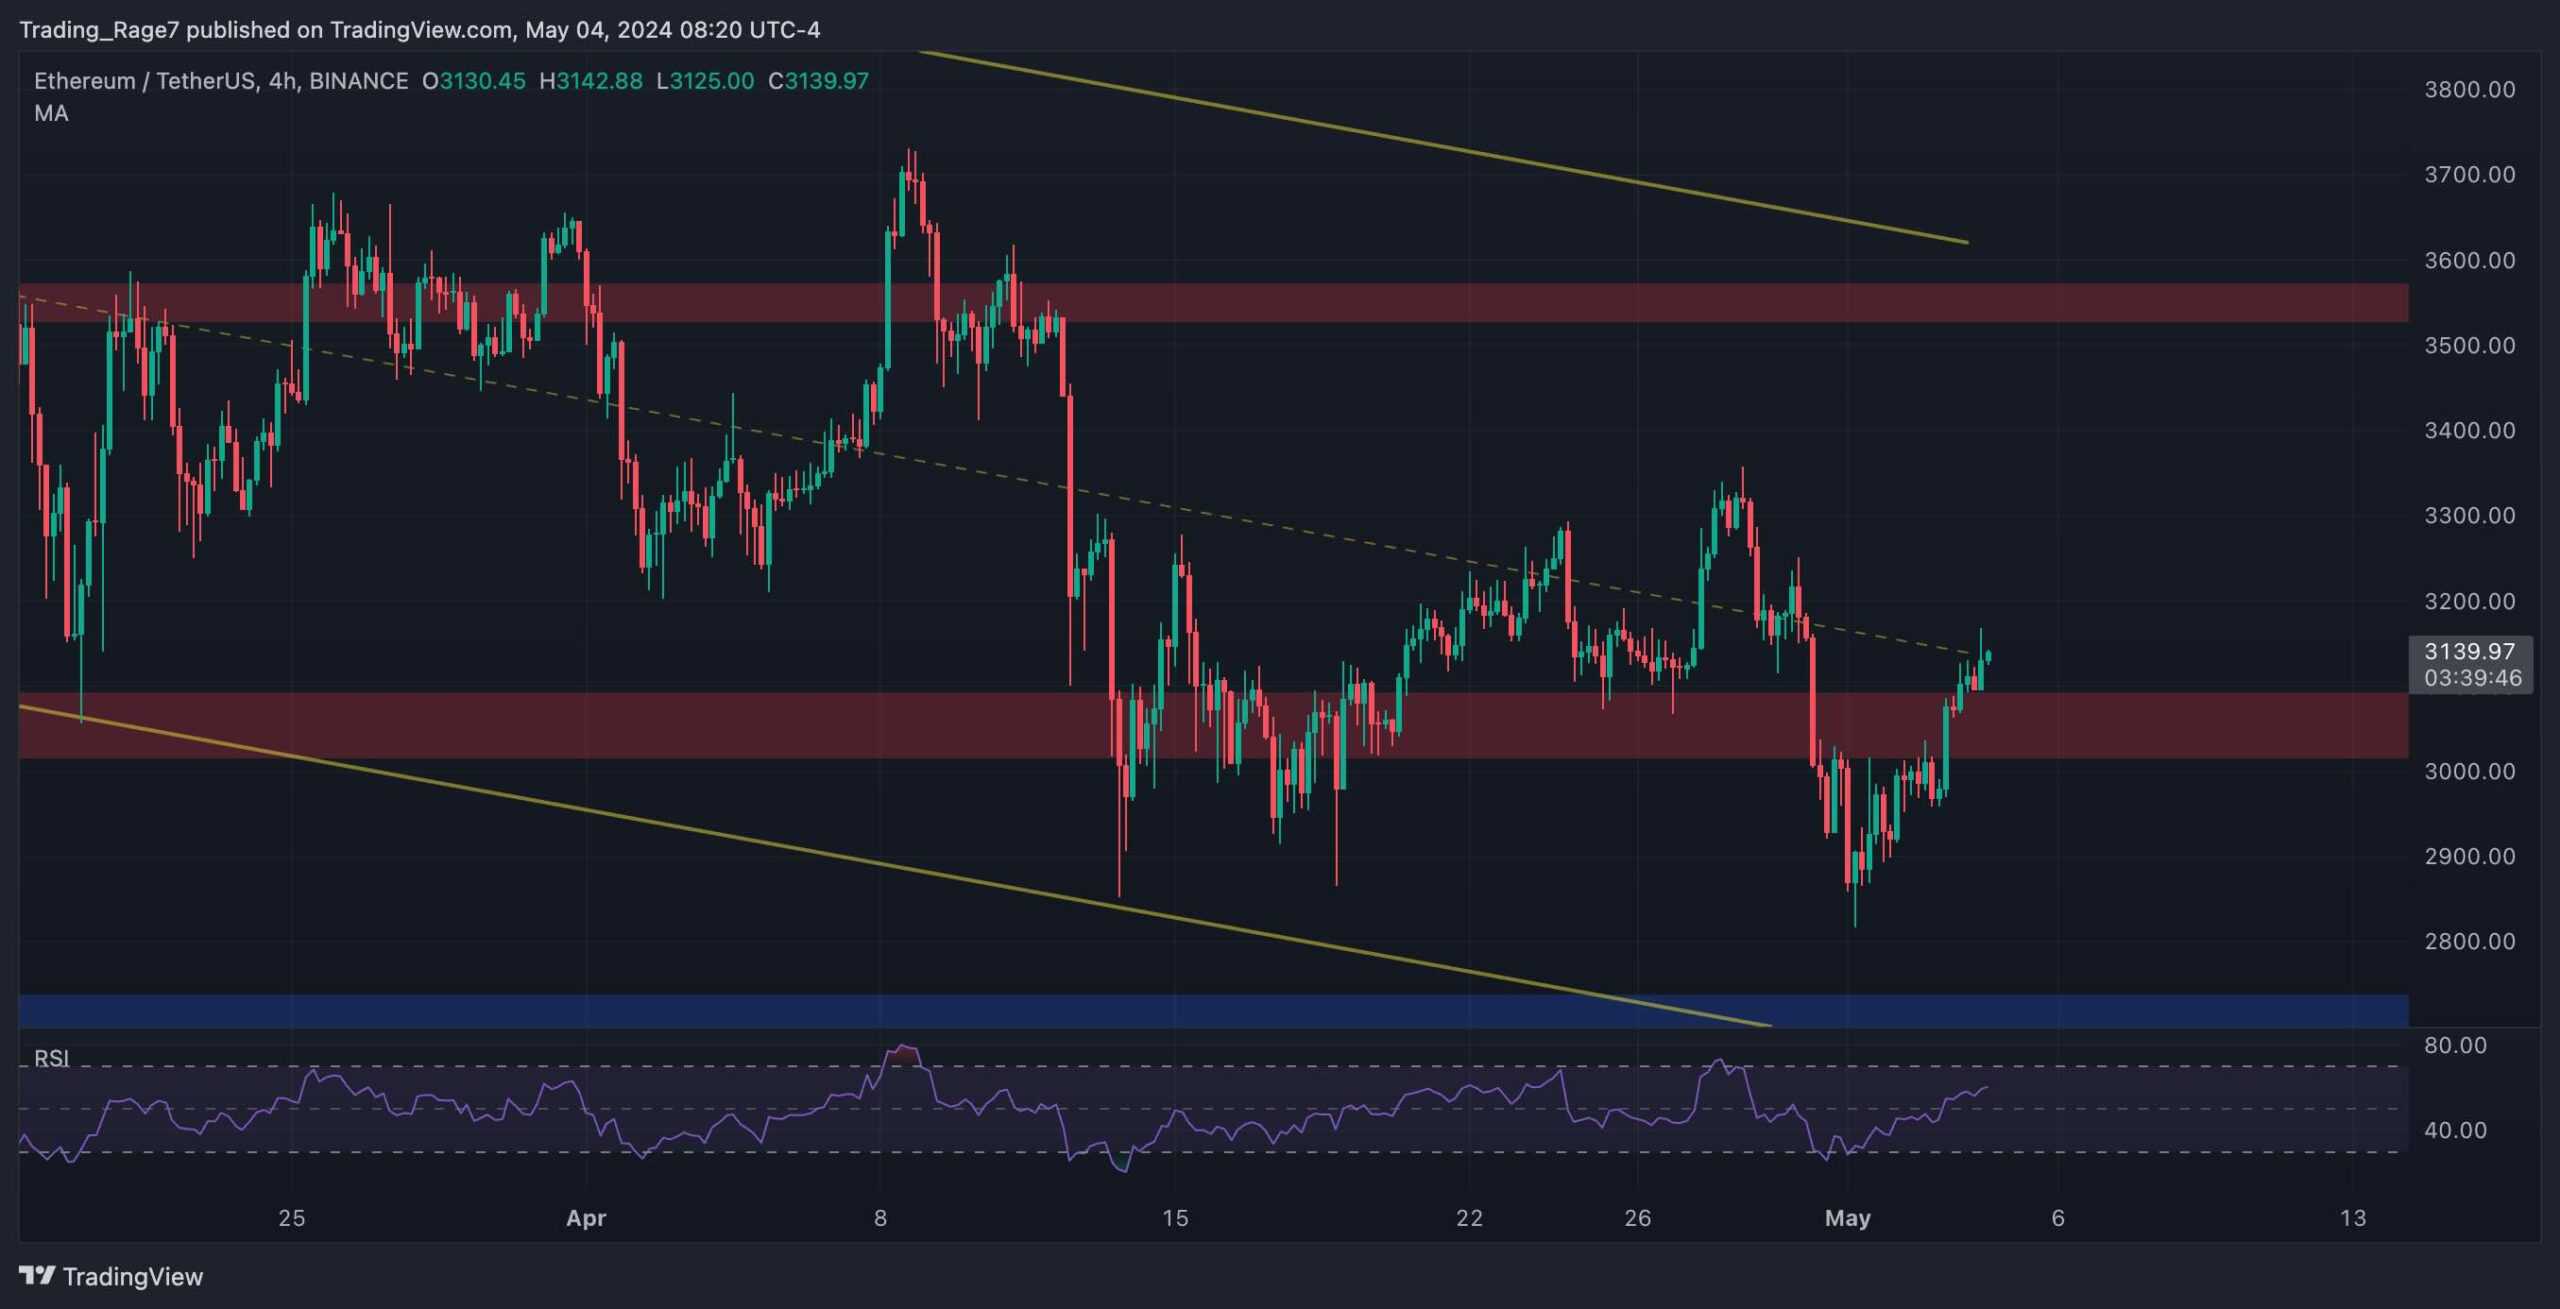
The 4-Hour Chart
The 4-hour chart offers a much clearer picture of recent price action. The market has barely broken through the $3,000 resistance zone and is currently testing the midline of the descending channel.
With the RSI showing values above 50%, ETH is likely to break through the level and potentially continue outward to the $3,600 resistance area. In this case, market participants can be optimistic that a new bullish wave will begin soon.
Sentiment Analysis
By TradingRage
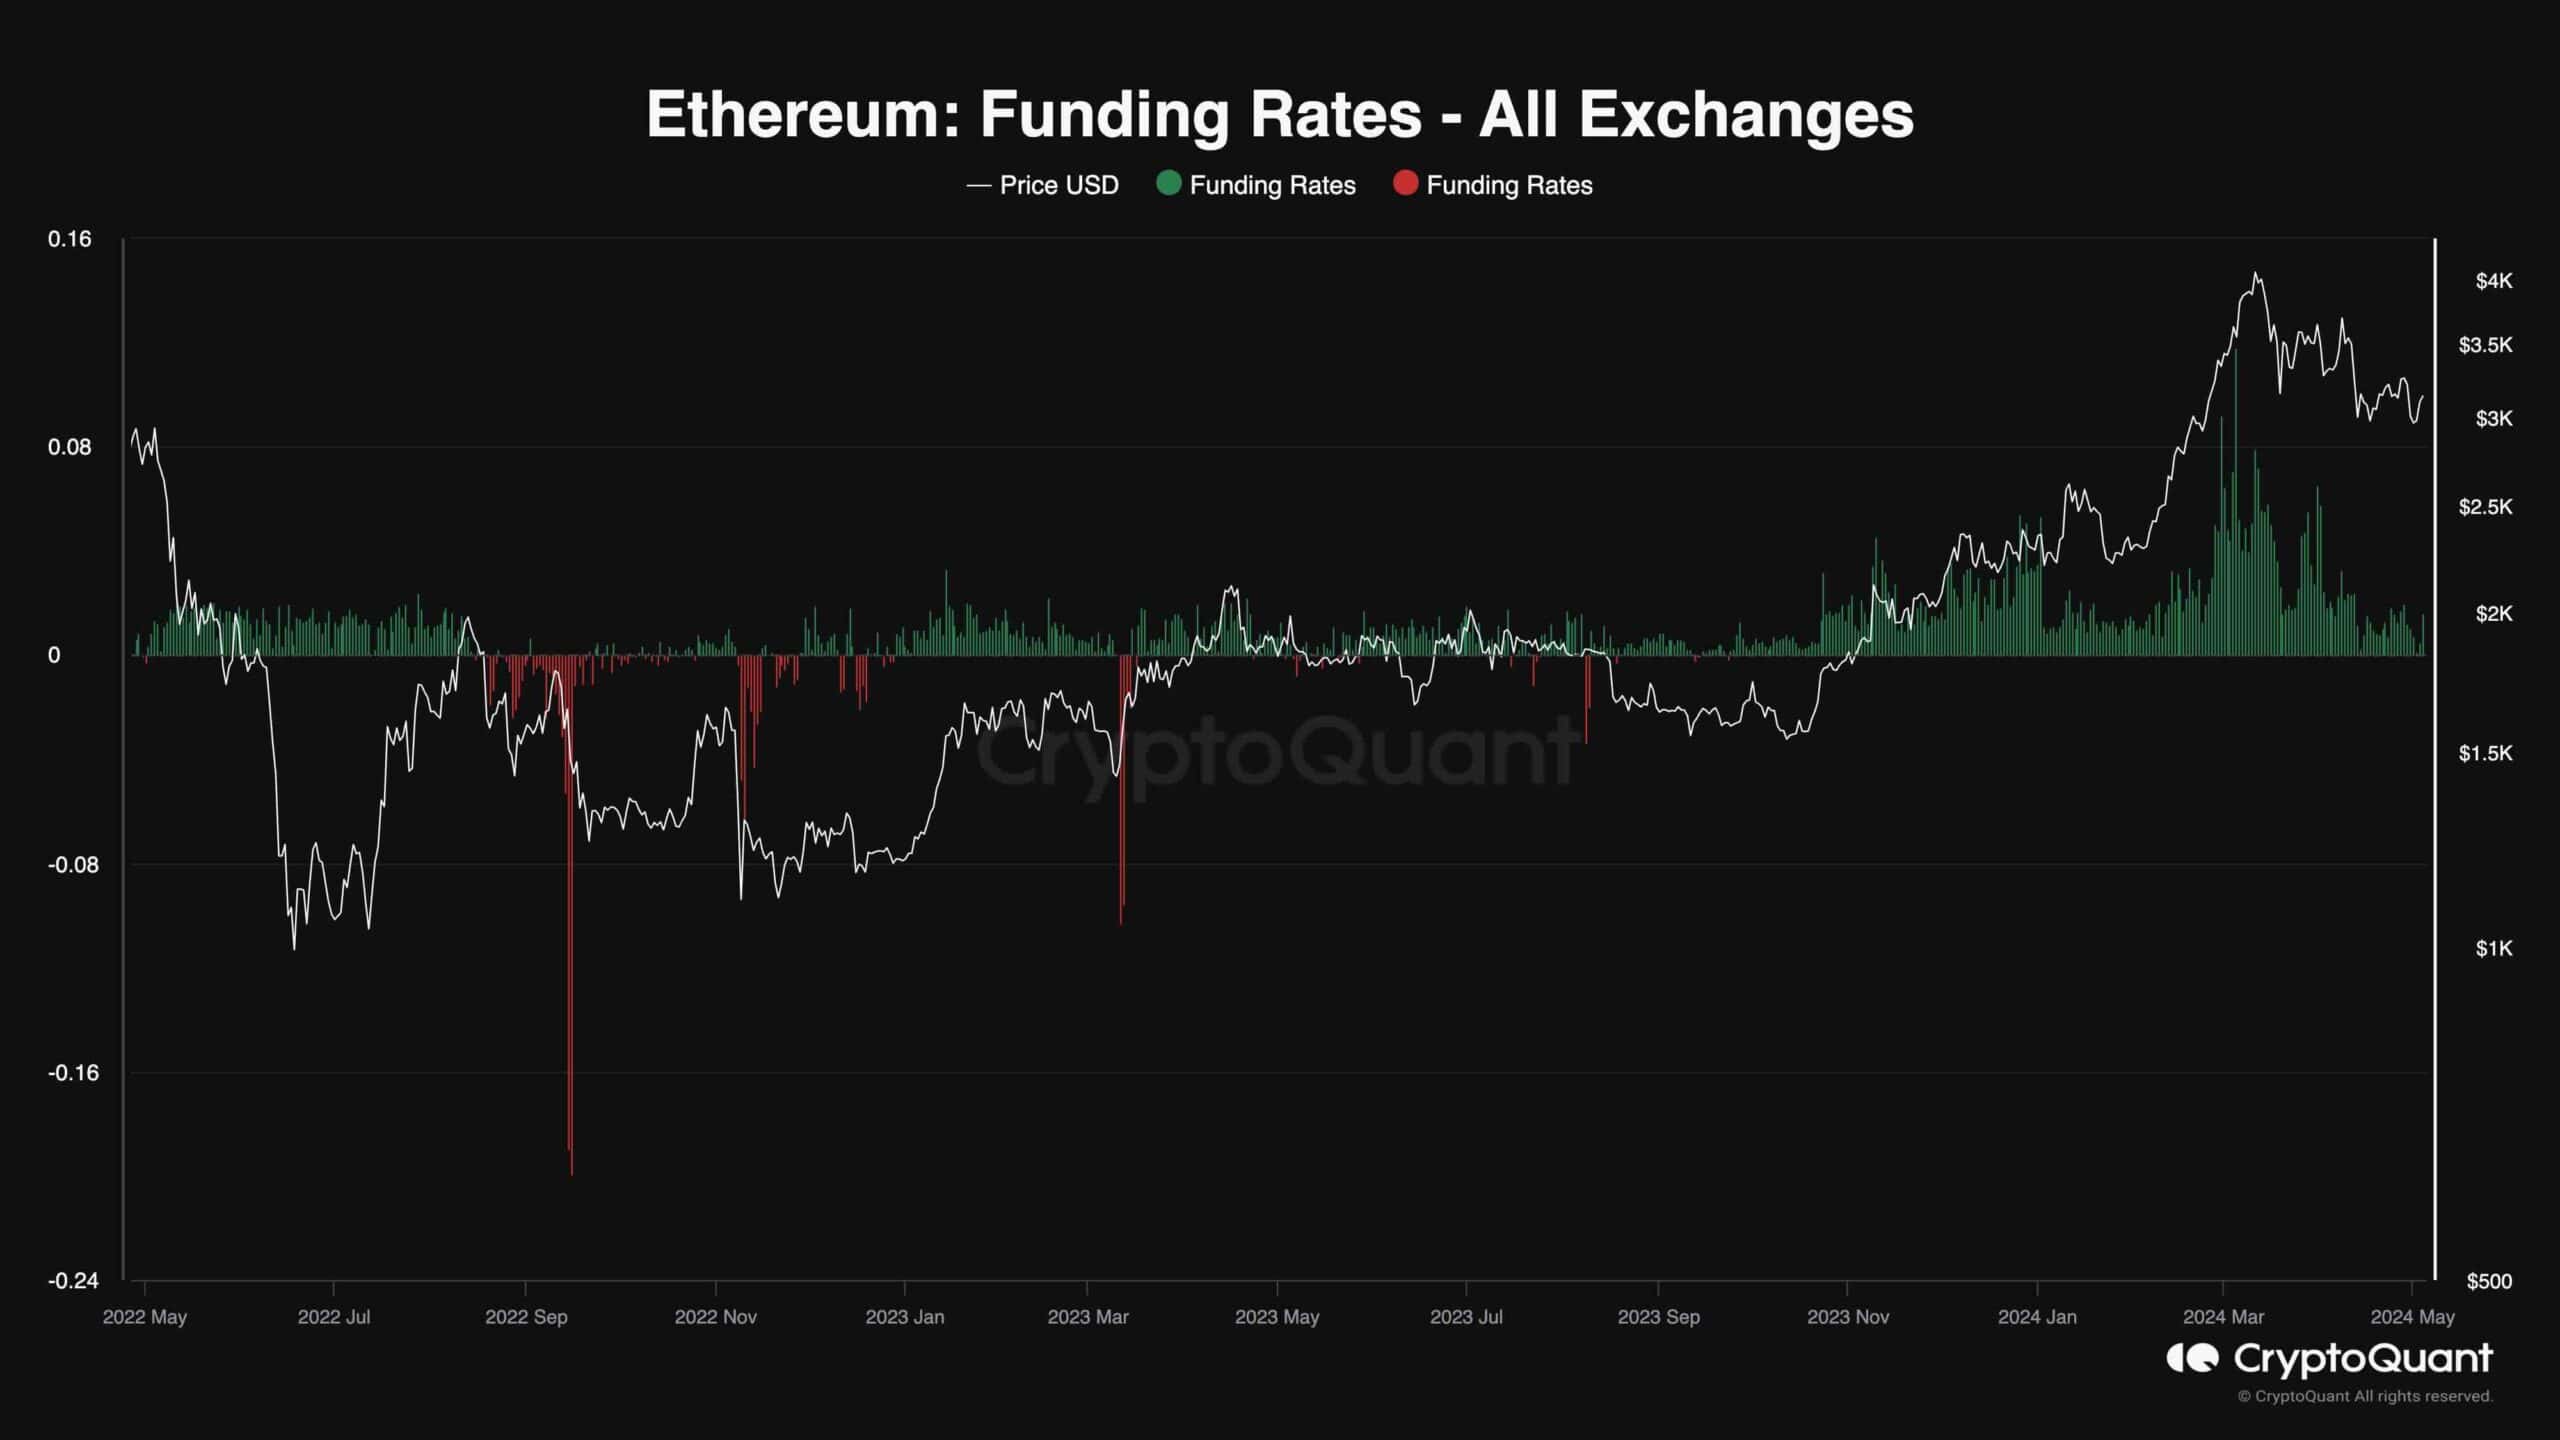
Ethereum Funding Rates
Following the recent decline in Ethereum’s price, many futures traders have been liquidated or reversed their long positions. This can be a good sign, as the futures market has seemingly cooled down.
This chart demonstrates the Ethereum funding rates metric, which measures whether buyers or sellers are executing their futures orders more aggressively (using market orders). Positive values point to bullish sentiment, while negative ones show bearish expectations.
It is evident that the funding rates have significantly dropped compared to a couple of months ago. Low but positive funding rates can be interpreted as a bullish signal, as they show that while the futures market is not overheated anymore, the demand is still there, and the price can soon rally higher.
The post Is the Ethereum Bull Market Back or is Another Dip Below $3K Imminent? (ETH Price Analysis) appeared first on CryptoPotato.
Read More

ETH Withdrawals Surge to $1.2B Weekly as Price Nears 3-Month High
Here’s What Can Send ETH Above $3K: Ethereum Price Analysis
Is the Ethereum Bull Market Back or is Another Dip Below $3K Imminent? (ETH Price Analysis)
Ethereum’s price is yet to continue its uptrend following a rejection from the $4,000 resistance level. But the bulls are now showing signs of strength, perhaps staging a more considerable recovery.
Technical Analysis
By TradingRage
The Daily Chart
As the daily chart depicts, Ethereum’s price has been making lower highs and lows inside a descending channel since failing to break above the $4,000 resistance level.
Yet, the cryptocurrency is climbing back above the $3,000 level and the midline of the channel. If the market successfully recovers back to these levels, a breakout above the channel and a continuation toward $4,000 and even higher prices can be expected.
The 4-Hour Chart
The 4-hour chart offers a much clearer picture of recent price action. The market has barely broken through the $3,000 resistance zone and is currently testing the midline of the descending channel.
With the RSI showing values above 50%, ETH is likely to break through the level and potentially continue outward to the $3,600 resistance area. In this case, market participants can be optimistic that a new bullish wave will begin soon.
Sentiment Analysis
By TradingRage
Ethereum Funding Rates
Following the recent decline in Ethereum’s price, many futures traders have been liquidated or reversed their long positions. This can be a good sign, as the futures market has seemingly cooled down.
This chart demonstrates the Ethereum funding rates metric, which measures whether buyers or sellers are executing their futures orders more aggressively (using market orders). Positive values point to bullish sentiment, while negative ones show bearish expectations.
It is evident that the funding rates have significantly dropped compared to a couple of months ago. Low but positive funding rates can be interpreted as a bullish signal, as they show that while the futures market is not overheated anymore, the demand is still there, and the price can soon rally higher.
The post Is the Ethereum Bull Market Back or is Another Dip Below $3K Imminent? (ETH Price Analysis) appeared first on CryptoPotato.
Read More
ETH Withdrawals Surge to $1.2B Weekly as Price Nears 3-Month High