


Why is the XRP Price Down Today? (Ripple Price Analysis)
Ripple is navigating a pivotal range between $1.8 and $3, with recent price action highlighting the likelihood of a consolidation phase.
A breakout from this range will likely determine its next significant trend.
XRP Price Analysis
By Shayan
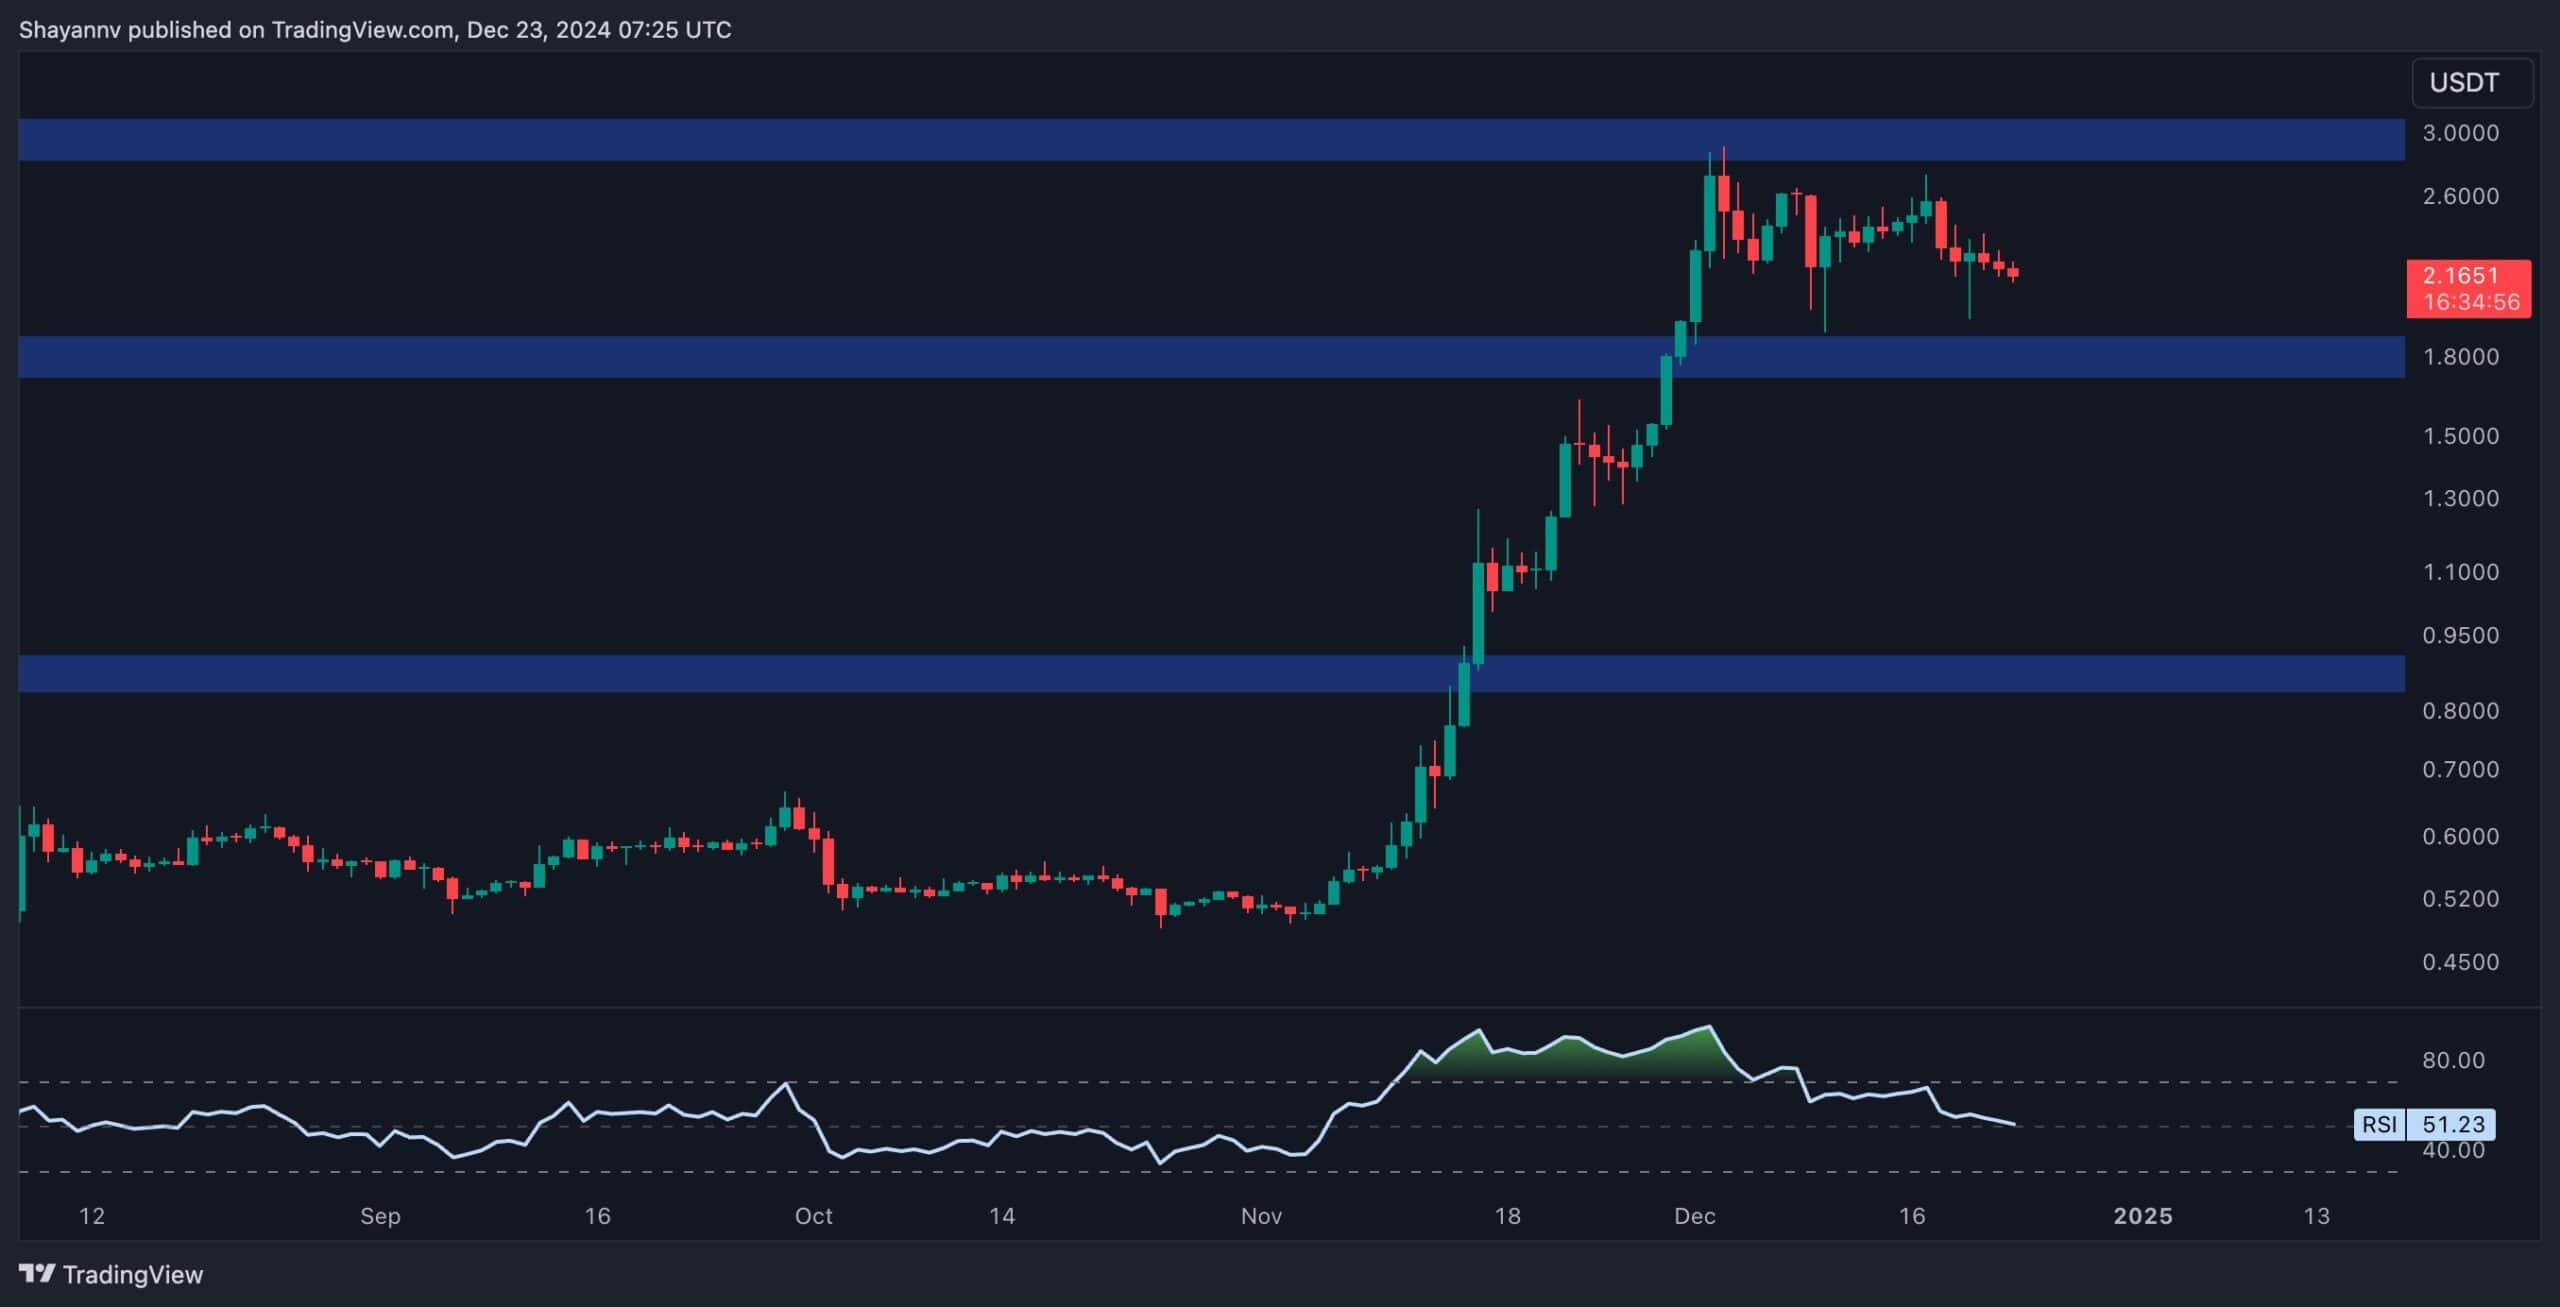
The Daily Chart
XRP recently faced rejection at the critical $3 resistance, triggering increased volatility and initiating a sideways consolidation phase. After that, the price found support at the $1.8 level, a key zone filled with demand and buying pressure.
This support region can limit further downward movement and maintain the cryptocurrency within the $1.8-$3 range.
As the price consolidates, a bullish or bearish breakout will determine Ripple’s upcoming trajectory. While this could lead to a sustained uptrend, an unexpected bearish breakdown might trigger a significant liquidation event, causing the price to plummet toward lower levels.
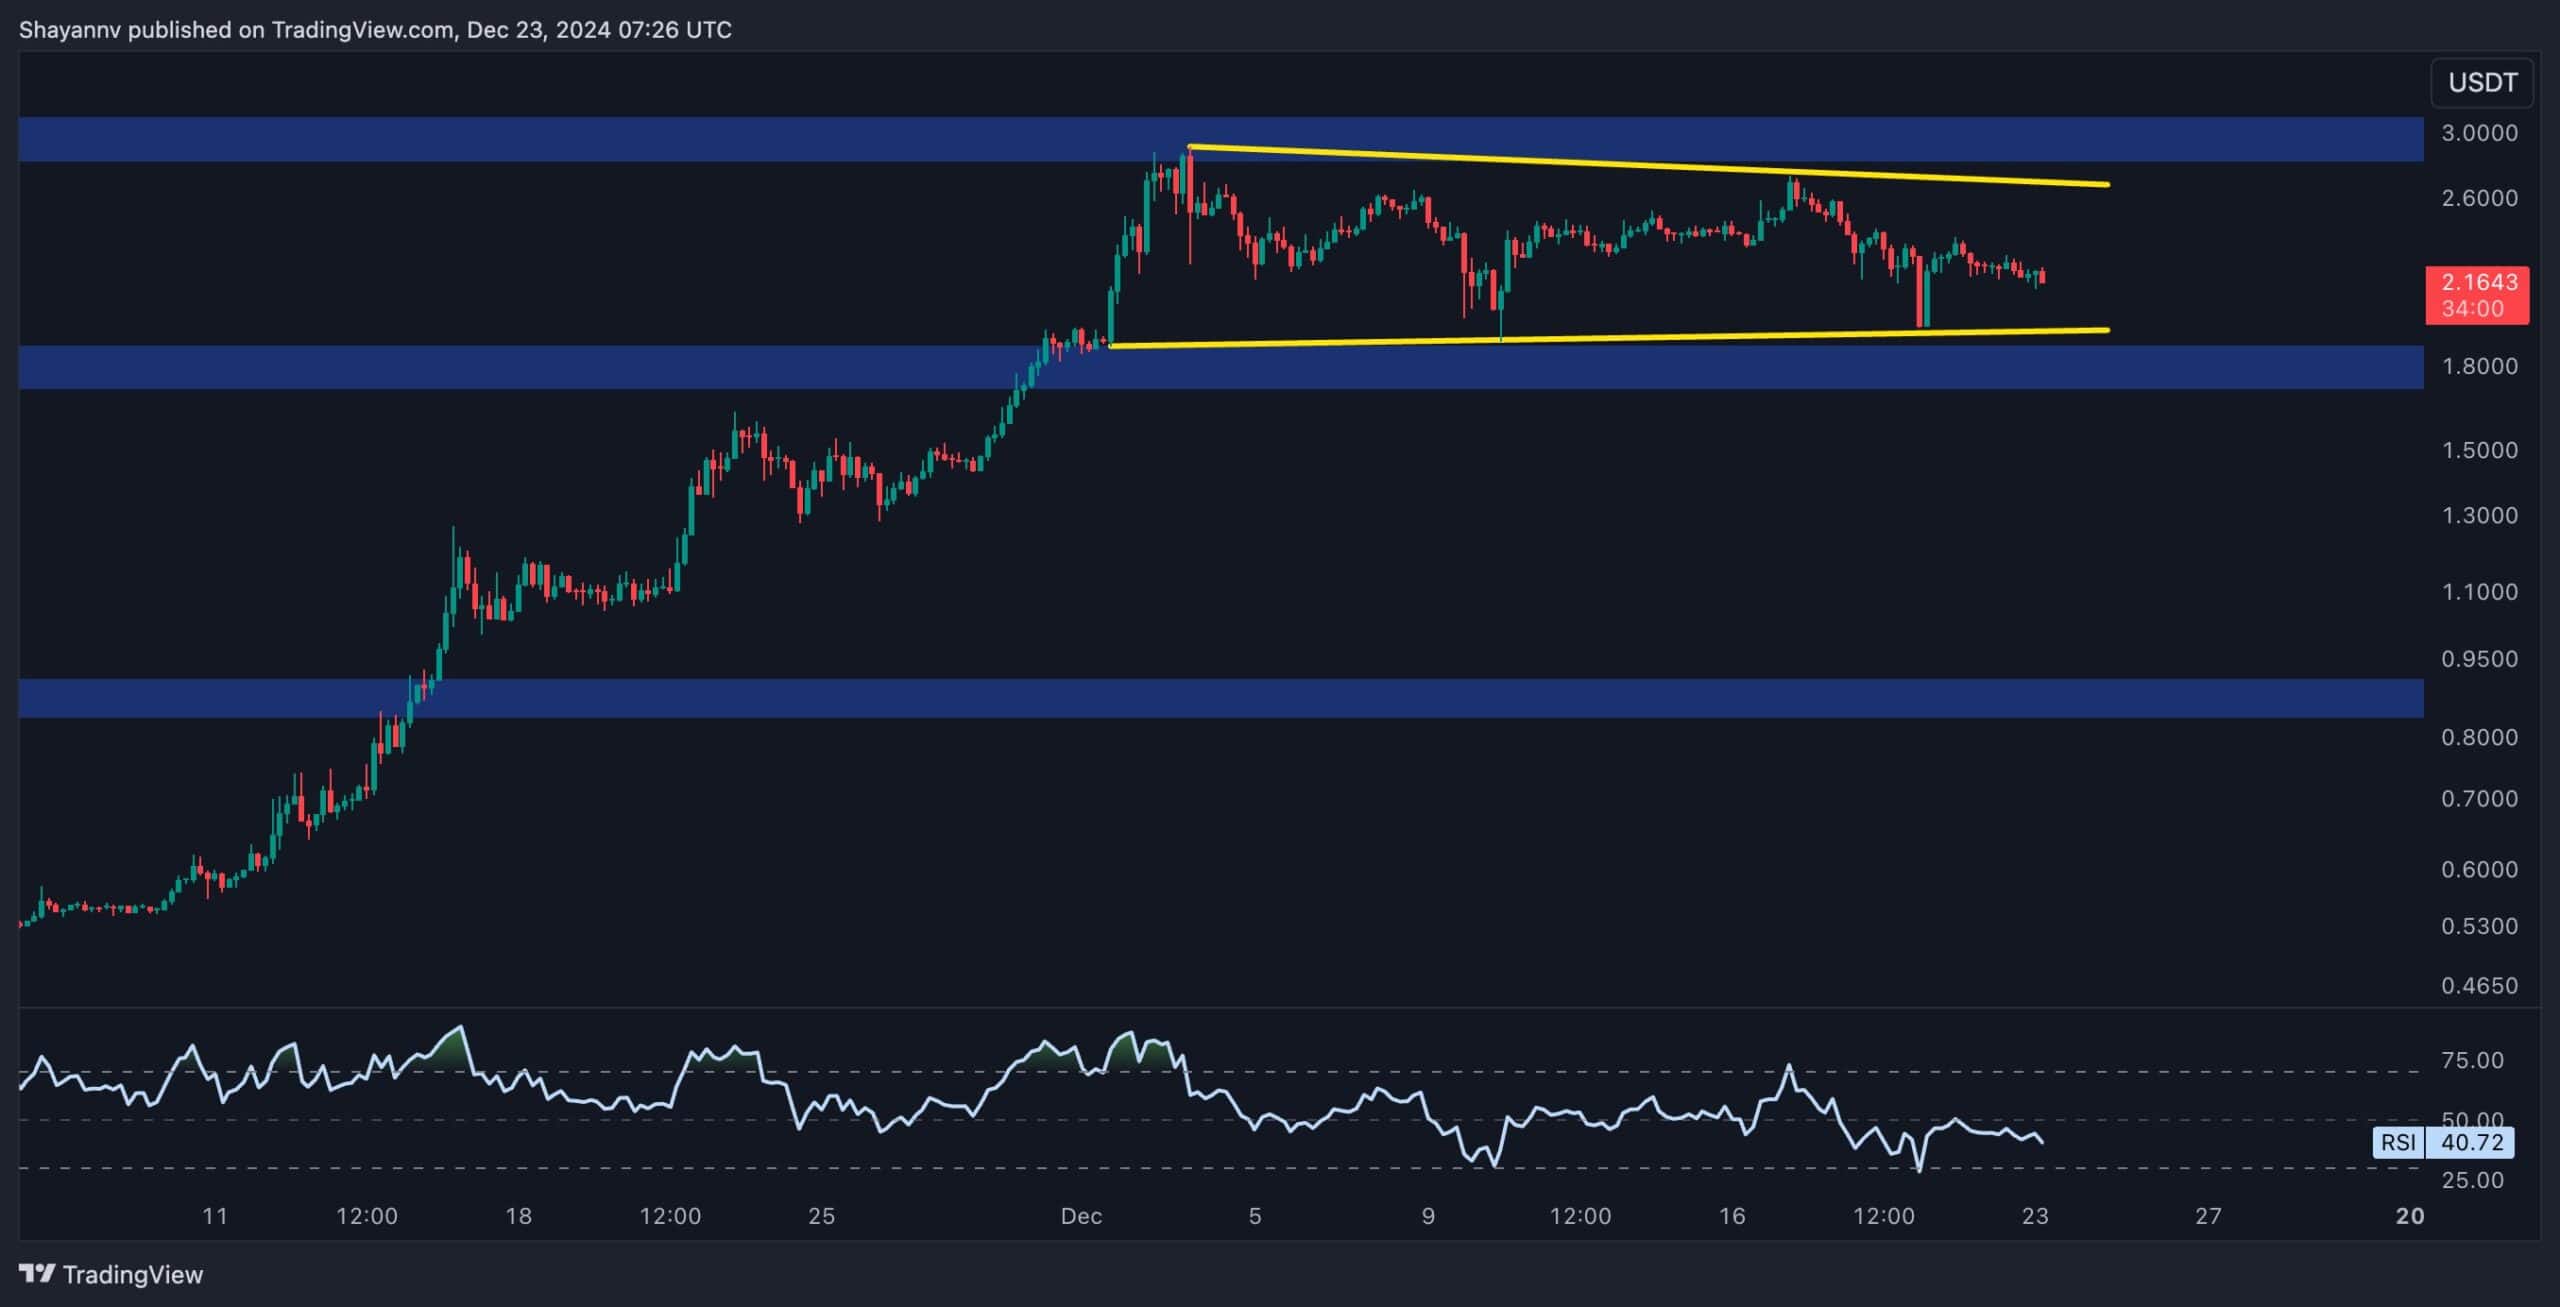
The 4-Hour Chart
During the 4-hour timeframe, XRP consolidates within a descending wedge pattern, which often signals a potential bullish breakout if breached upward.
Currently, the price is testing the wedge’s lower boundary near the $1.8 support level, where increased buying activity is expected.
In the mid-term, Ripple seems likely to continue fluctuating within this pattern, with a bullish breakout aiming to reclaim higher levels near $3. Conversely, a bearish breakdown below the wedge’s lower boundary could initiate a decline, potentially driving the price toward the $1.5 threshold, a crucial support level.
The post Why is the XRP Price Down Today? (Ripple Price Analysis) appeared first on CryptoPotato.
Read More

Ripple (XRP) Price Predictions for This Week
Why is the XRP Price Down Today? (Ripple Price Analysis)
Ripple is navigating a pivotal range between $1.8 and $3, with recent price action highlighting the likelihood of a consolidation phase.
A breakout from this range will likely determine its next significant trend.
XRP Price Analysis
By Shayan
The Daily Chart
XRP recently faced rejection at the critical $3 resistance, triggering increased volatility and initiating a sideways consolidation phase. After that, the price found support at the $1.8 level, a key zone filled with demand and buying pressure.
This support region can limit further downward movement and maintain the cryptocurrency within the $1.8-$3 range.
As the price consolidates, a bullish or bearish breakout will determine Ripple’s upcoming trajectory. While this could lead to a sustained uptrend, an unexpected bearish breakdown might trigger a significant liquidation event, causing the price to plummet toward lower levels.
The 4-Hour Chart
During the 4-hour timeframe, XRP consolidates within a descending wedge pattern, which often signals a potential bullish breakout if breached upward.
Currently, the price is testing the wedge’s lower boundary near the $1.8 support level, where increased buying activity is expected.
In the mid-term, Ripple seems likely to continue fluctuating within this pattern, with a bullish breakout aiming to reclaim higher levels near $3. Conversely, a bearish breakdown below the wedge’s lower boundary could initiate a decline, potentially driving the price toward the $1.5 threshold, a crucial support level.
The post Why is the XRP Price Down Today? (Ripple Price Analysis) appeared first on CryptoPotato.
Read More