


Bitcoin to $200K? Analyst’s Bullish Take

Coinspeaker
Bitcoin to $200K? Analyst’s Bullish Take
Bitcoin (BTC) is showing renewed signs of strength, rebounding sharply after a volatile start to the week with billions being wiped off from the global crypto market cap.
The largest cryptocurrency by valuation reached a daily high of $83,541, and at press time, it was trading at $81,671.81, representing a 6% increase in the past 24 hours.
A 28.90% spike in trading volume suggests a retest of the 20-day Exponential Moving Average (EMA) at $82,630, a critical resistance level. A break above this zone could indicate the return of bullish momentum.
Mayer Multiple Hints at $208K Market Top
Crypto analyst Ali Martinez recently pointed to the Mayer Multiple, a long-term valuation metric comparing BTC’s price to its 200-day moving average.
Based on the Mayer Multiple, #Bitcoin $BTC could find solid support around $69,500. And, a breakout above $86,900 might set the stage for a market top near $208,550. pic.twitter.com/aoLK9F4vrI
— Ali (@ali_charts) April 10, 2025
His chart shows that Bitcoin is approaching a historically significant breakout threshold. It illustrates previous bull cycles where Bitcoin rallied significantly after breaking above the upper oscillator band (2.4x the 200DMA). BTC is currently nearing that band again, which has often preceded parabolic moves.
BTC Price Analysis
Looking at short-term momentum, Bitcoin is trading just below the upper band of the Bollinger Bands (BB) on the daily chart, with the bands currently spanning between $77,530 and $89,221.
BTC is quite close to the middle band (20-SMA at $83,376), which aligns closely with the 20-day EMA. If Bitcoin closes above this level and maintains volume, it may attempt another move toward the upper BB resistance near $89,200.
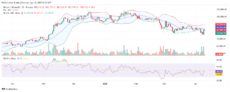
Bitcoin’s Price Chart | Source: TradingView
On the other hand, the Relative Strength Index (RSI) is currently at 46.72, signaling neutral momentum. However, its recent uptick from oversold territory indicates a potential bullish reversal forming.
If RSI crosses above 50, it could signal renewed buying interest.
ETF Outflows and Bullish Predictions
Despite the price rally, US-listed spot Bitcoin ETFs continue to experience outflows.
On Wednesday, the funds saw $127.2 million in net outflows, with BlackRock’s IBIT losing $89.7 million alone. This marked the fifth straight day of outflows, totaling $722 million.
However, adding fuel to the bullish fire, Bitwise CIO Matt Hougan reaffirmed his year-end price target of $200,000 for Bitcoin.
Despite growing trade tensions and ETF outflows, Hougan argues that the Trump administration’s tariff pause and push for a weaker US dollar could catalyze a Bitcoin breakout.
He highlighted comments from Steve Miran of the White House Council of Economic Advisers, who criticized the dollar’s role as a global reserve currency.
If the US continues to weaken the greenback, Bitcoin could benefit from its inverse correlation with the US Dollar Index (DXY).
Read More

Bitcoin Price Could Be Preparing For Fresh Wave Of Volatility — Here’s Why

Is Bitcoin Bull Run Back? Daily RSI Shows Only Mild Bullish Momentum
Bitcoin to $200K? Analyst’s Bullish Take
Coinspeaker
Bitcoin to $200K? Analyst’s Bullish Take
Bitcoin (BTC) is showing renewed signs of strength, rebounding sharply after a volatile start to the week with billions being wiped off from the global crypto market cap.
The largest cryptocurrency by valuation reached a daily high of $83,541, and at press time, it was trading at $81,671.81, representing a 6% increase in the past 24 hours.
A 28.90% spike in trading volume suggests a retest of the 20-day Exponential Moving Average (EMA) at $82,630, a critical resistance level. A break above this zone could indicate the return of bullish momentum.
Mayer Multiple Hints at $208K Market Top
Crypto analyst Ali Martinez recently pointed to the Mayer Multiple, a long-term valuation metric comparing BTC’s price to its 200-day moving average.
Based on the Mayer Multiple, #Bitcoin $BTC could find solid support around $69,500. And, a breakout above $86,900 might set the stage for a market top near $208,550. pic.twitter.com/aoLK9F4vrI
— Ali (@ali_charts) April 10, 2025
His chart shows that Bitcoin is approaching a historically significant breakout threshold. It illustrates previous bull cycles where Bitcoin rallied significantly after breaking above the upper oscillator band (2.4x the 200DMA). BTC is currently nearing that band again, which has often preceded parabolic moves.
BTC Price Analysis
Looking at short-term momentum, Bitcoin is trading just below the upper band of the Bollinger Bands (BB) on the daily chart, with the bands currently spanning between $77,530 and $89,221.
BTC is quite close to the middle band (20-SMA at $83,376), which aligns closely with the 20-day EMA. If Bitcoin closes above this level and maintains volume, it may attempt another move toward the upper BB resistance near $89,200.
Bitcoin’s Price Chart | Source: TradingView
On the other hand, the Relative Strength Index (RSI) is currently at 46.72, signaling neutral momentum. However, its recent uptick from oversold territory indicates a potential bullish reversal forming.
If RSI crosses above 50, it could signal renewed buying interest.
ETF Outflows and Bullish Predictions
Despite the price rally, US-listed spot Bitcoin ETFs continue to experience outflows.
On Wednesday, the funds saw $127.2 million in net outflows, with BlackRock’s IBIT losing $89.7 million alone. This marked the fifth straight day of outflows, totaling $722 million.
However, adding fuel to the bullish fire, Bitwise CIO Matt Hougan reaffirmed his year-end price target of $200,000 for Bitcoin.
Despite growing trade tensions and ETF outflows, Hougan argues that the Trump administration’s tariff pause and push for a weaker US dollar could catalyze a Bitcoin breakout.
He highlighted comments from Steve Miran of the White House Council of Economic Advisers, who criticized the dollar’s role as a global reserve currency.
If the US continues to weaken the greenback, Bitcoin could benefit from its inverse correlation with the US Dollar Index (DXY).
Read More
Bitcoin Price Could Be Preparing For Fresh Wave Of Volatility — Here’s Why