


Will DOT Price Top $10 With This Double Bottom At $6?

The post Will DOT Price Top $10 With This Double Bottom At $6? appeared first on Coinpedia Fintech News
Ranking amongst the top performers, Polkadot shows a promising recovery opportunity as it overcomes the supply surge. With a bullish turnaround possibility, the DOT price is slowly gaining momentum and the attention of market bulls.
As the altcoins are suffering to halt the downtrend, the DOT price is ready for an ascension. Will this reversal lead to a massive surge in Polkadot to beyond the $10 milestone? Find out more in our Polkadot price prediction for a long-term picture.
Polkadot Price Performance
Failing to sustain the early 2024 bull run, a bearish reversal from the $12 mark leads to a massive drop in just two months. A 50% correction with a lower high formation fractures the 200D EMA and influences a bearish impact on 50D EMA, teasing a death cross.
With a market cap of $9.32 Billion, Polkadot ranks at #15 in the crypto market and the DOT price trades at $6.86, with an intraday move of 6.30%.
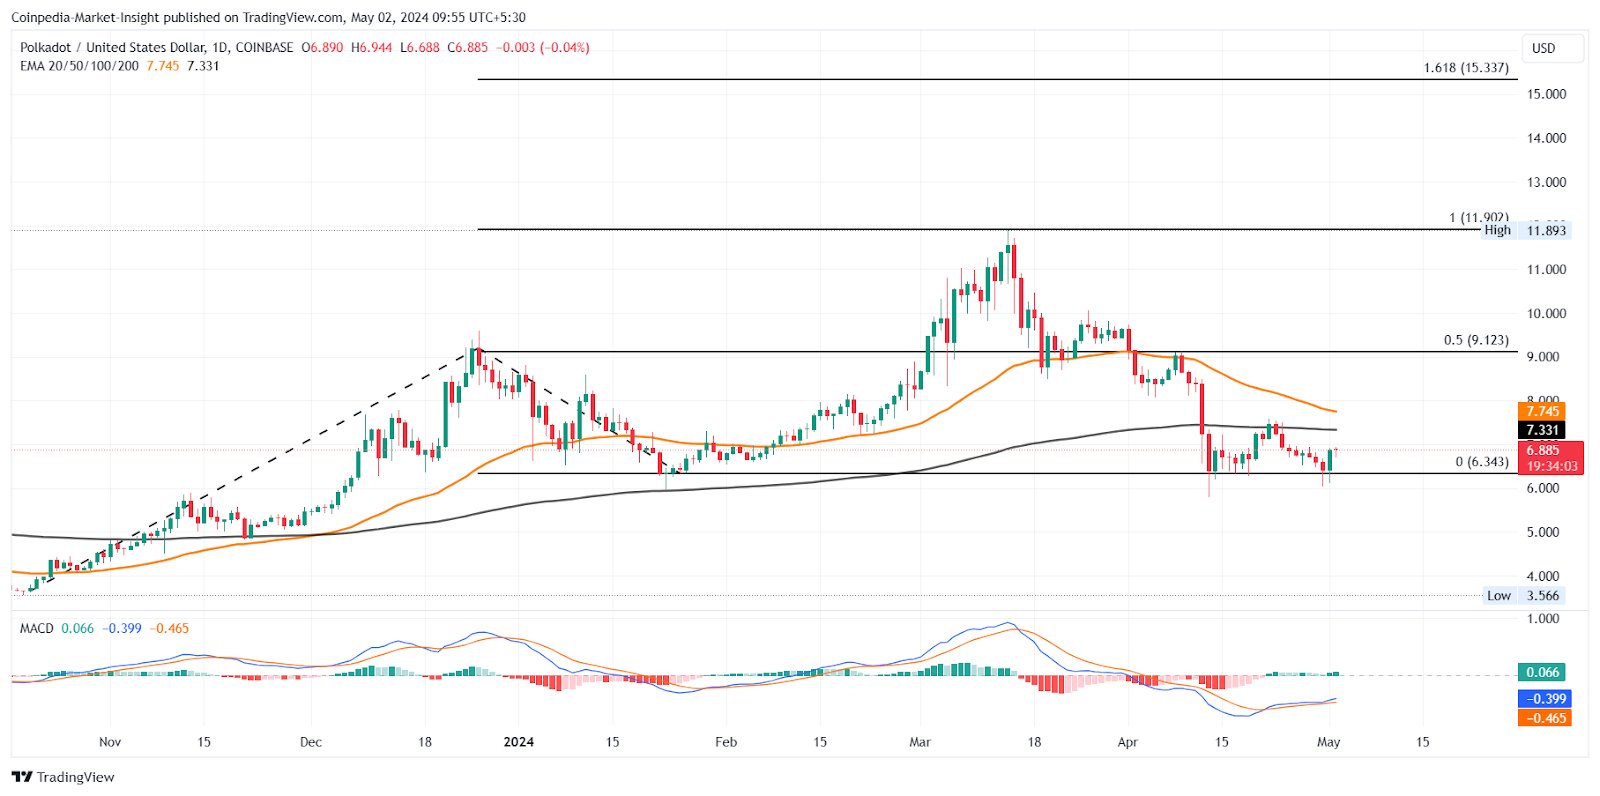
Tradingview
The downtrend in DOT price takes a lateral shift at the crucial support level of $6 under the 200D EMA. Further, the underlying bullish shift leads to a double bottom pattern, with the intraday growth signaling an ignition.
Considering the Polkadot manages to find additional demand to fuel the recovery rally, the buyers could give a double bottom breakout. With this, the altcoin could enter a high momentum recovery to surpass $10 and avoid the death cross.
Technical Indicators:
EMA Indicator: The declining gap between the 50D and 200D EMA warns of a death cross.
RSI: The daily RSI shows a bullish recovery from the oversold zone with a divergence in the double bottom. This increases the bullish reversal chances in the DOT price trend.
MACD: The ongoing recovery in the MACD and signal lines, merged together, reflect a rise in bullish momentum.
Will The DOT Price Give A Bullish Break?
In case of a bullish reversal, the DOT price could price reach the $10 mark or the $12 milestone, the 100% Fibonacci trend-based level. On the flip side, a slip under $6 could dump Polkadot to $5.
Read More


Will DOT Price Top $10 With This Double Bottom At $6?
The post Will DOT Price Top $10 With This Double Bottom At $6? appeared first on Coinpedia Fintech News
Ranking amongst the top performers, Polkadot shows a promising recovery opportunity as it overcomes the supply surge. With a bullish turnaround possibility, the DOT price is slowly gaining momentum and the attention of market bulls.
As the altcoins are suffering to halt the downtrend, the DOT price is ready for an ascension. Will this reversal lead to a massive surge in Polkadot to beyond the $10 milestone? Find out more in our Polkadot price prediction for a long-term picture.
Polkadot Price Performance
Failing to sustain the early 2024 bull run, a bearish reversal from the $12 mark leads to a massive drop in just two months. A 50% correction with a lower high formation fractures the 200D EMA and influences a bearish impact on 50D EMA, teasing a death cross.
With a market cap of $9.32 Billion, Polkadot ranks at #15 in the crypto market and the DOT price trades at $6.86, with an intraday move of 6.30%.
Tradingview
The downtrend in DOT price takes a lateral shift at the crucial support level of $6 under the 200D EMA. Further, the underlying bullish shift leads to a double bottom pattern, with the intraday growth signaling an ignition.
Considering the Polkadot manages to find additional demand to fuel the recovery rally, the buyers could give a double bottom breakout. With this, the altcoin could enter a high momentum recovery to surpass $10 and avoid the death cross.
Technical Indicators:
EMA Indicator: The declining gap between the 50D and 200D EMA warns of a death cross.
RSI: The daily RSI shows a bullish recovery from the oversold zone with a divergence in the double bottom. This increases the bullish reversal chances in the DOT price trend.
MACD: The ongoing recovery in the MACD and signal lines, merged together, reflect a rise in bullish momentum.
Will The DOT Price Give A Bullish Break?
In case of a bullish reversal, the DOT price could price reach the $10 mark or the $12 milestone, the 100% Fibonacci trend-based level. On the flip side, a slip under $6 could dump Polkadot to $5.
Read More