Here’s why BT Group share price is set to soar despite Broadband lossses
Share:
BT Group shares rallied from 171p in Nov 2025 to ~218–220p in Apr 2026 (highest since 2016); technicals show a cup‑and‑handle with target ~250p and invalidation below 198p, trading above 50- and 100‑day EMAs. - Fundamental pressure: Q3 revenue -4% to £4.97bn, broadband lines down 210k in the quarter (FY loss est 850k), fibre customers 21m; FY26 consensus revenue £19.6bn (-3.4% YoY), EBITDA ~£8.21bn forecast and dividend rising from 8.39p (FY26) to 9.05p (FY28). No direct crypto/DeFi/DEX/CEX or token implications—minimal crypto market impact; keywords: crypto, DeFi, DEX, CEX, adoption, token launch, fundraising, security.
Predictions Markets
See what traders are focused on

BT Group share price has done well this year and is hovering at its highest level since 2016. It was trading at 218p on Thursday, up sharply from last year's low of 171p. This rally may continue as it has formed the highly bullish cup-and-handle pattern.
BT Group share price has formed bullish chart patterns
The daily timeframe chart shows that the BT share price has jumped in the past few months, moving from a low of 171p in November last year to the current 220p.
A closer look shows that the stock is flashing bullish patterns, which may lead to more gains in the coming days or months.
At the base level, the stock has remained constantly above the 50-day and 100-day Exponential Moving Averages (EMA), a sign that bulls remain in control for now.
The stock has also formed a cup-and-handle pattern, which is made up of a rounded bottom and a consolidation at the top. A closer look at this pattern shows that it always resembles a real cup.
It completed the formation of the cup section and is now in the handle zone. A closer look at this handle shows that it resembles an inverted head-and-shoulders pattern, which is a common bullish reversal sign. Its neckline is along the year-to-date high of 220p.
Therefore, these patterns mean that the stock will likely bounce back in the coming days, with the next key target being at the psychological level at 250p. The C&H pattern will become invalid if it drops below the year-to-date low of 198p.
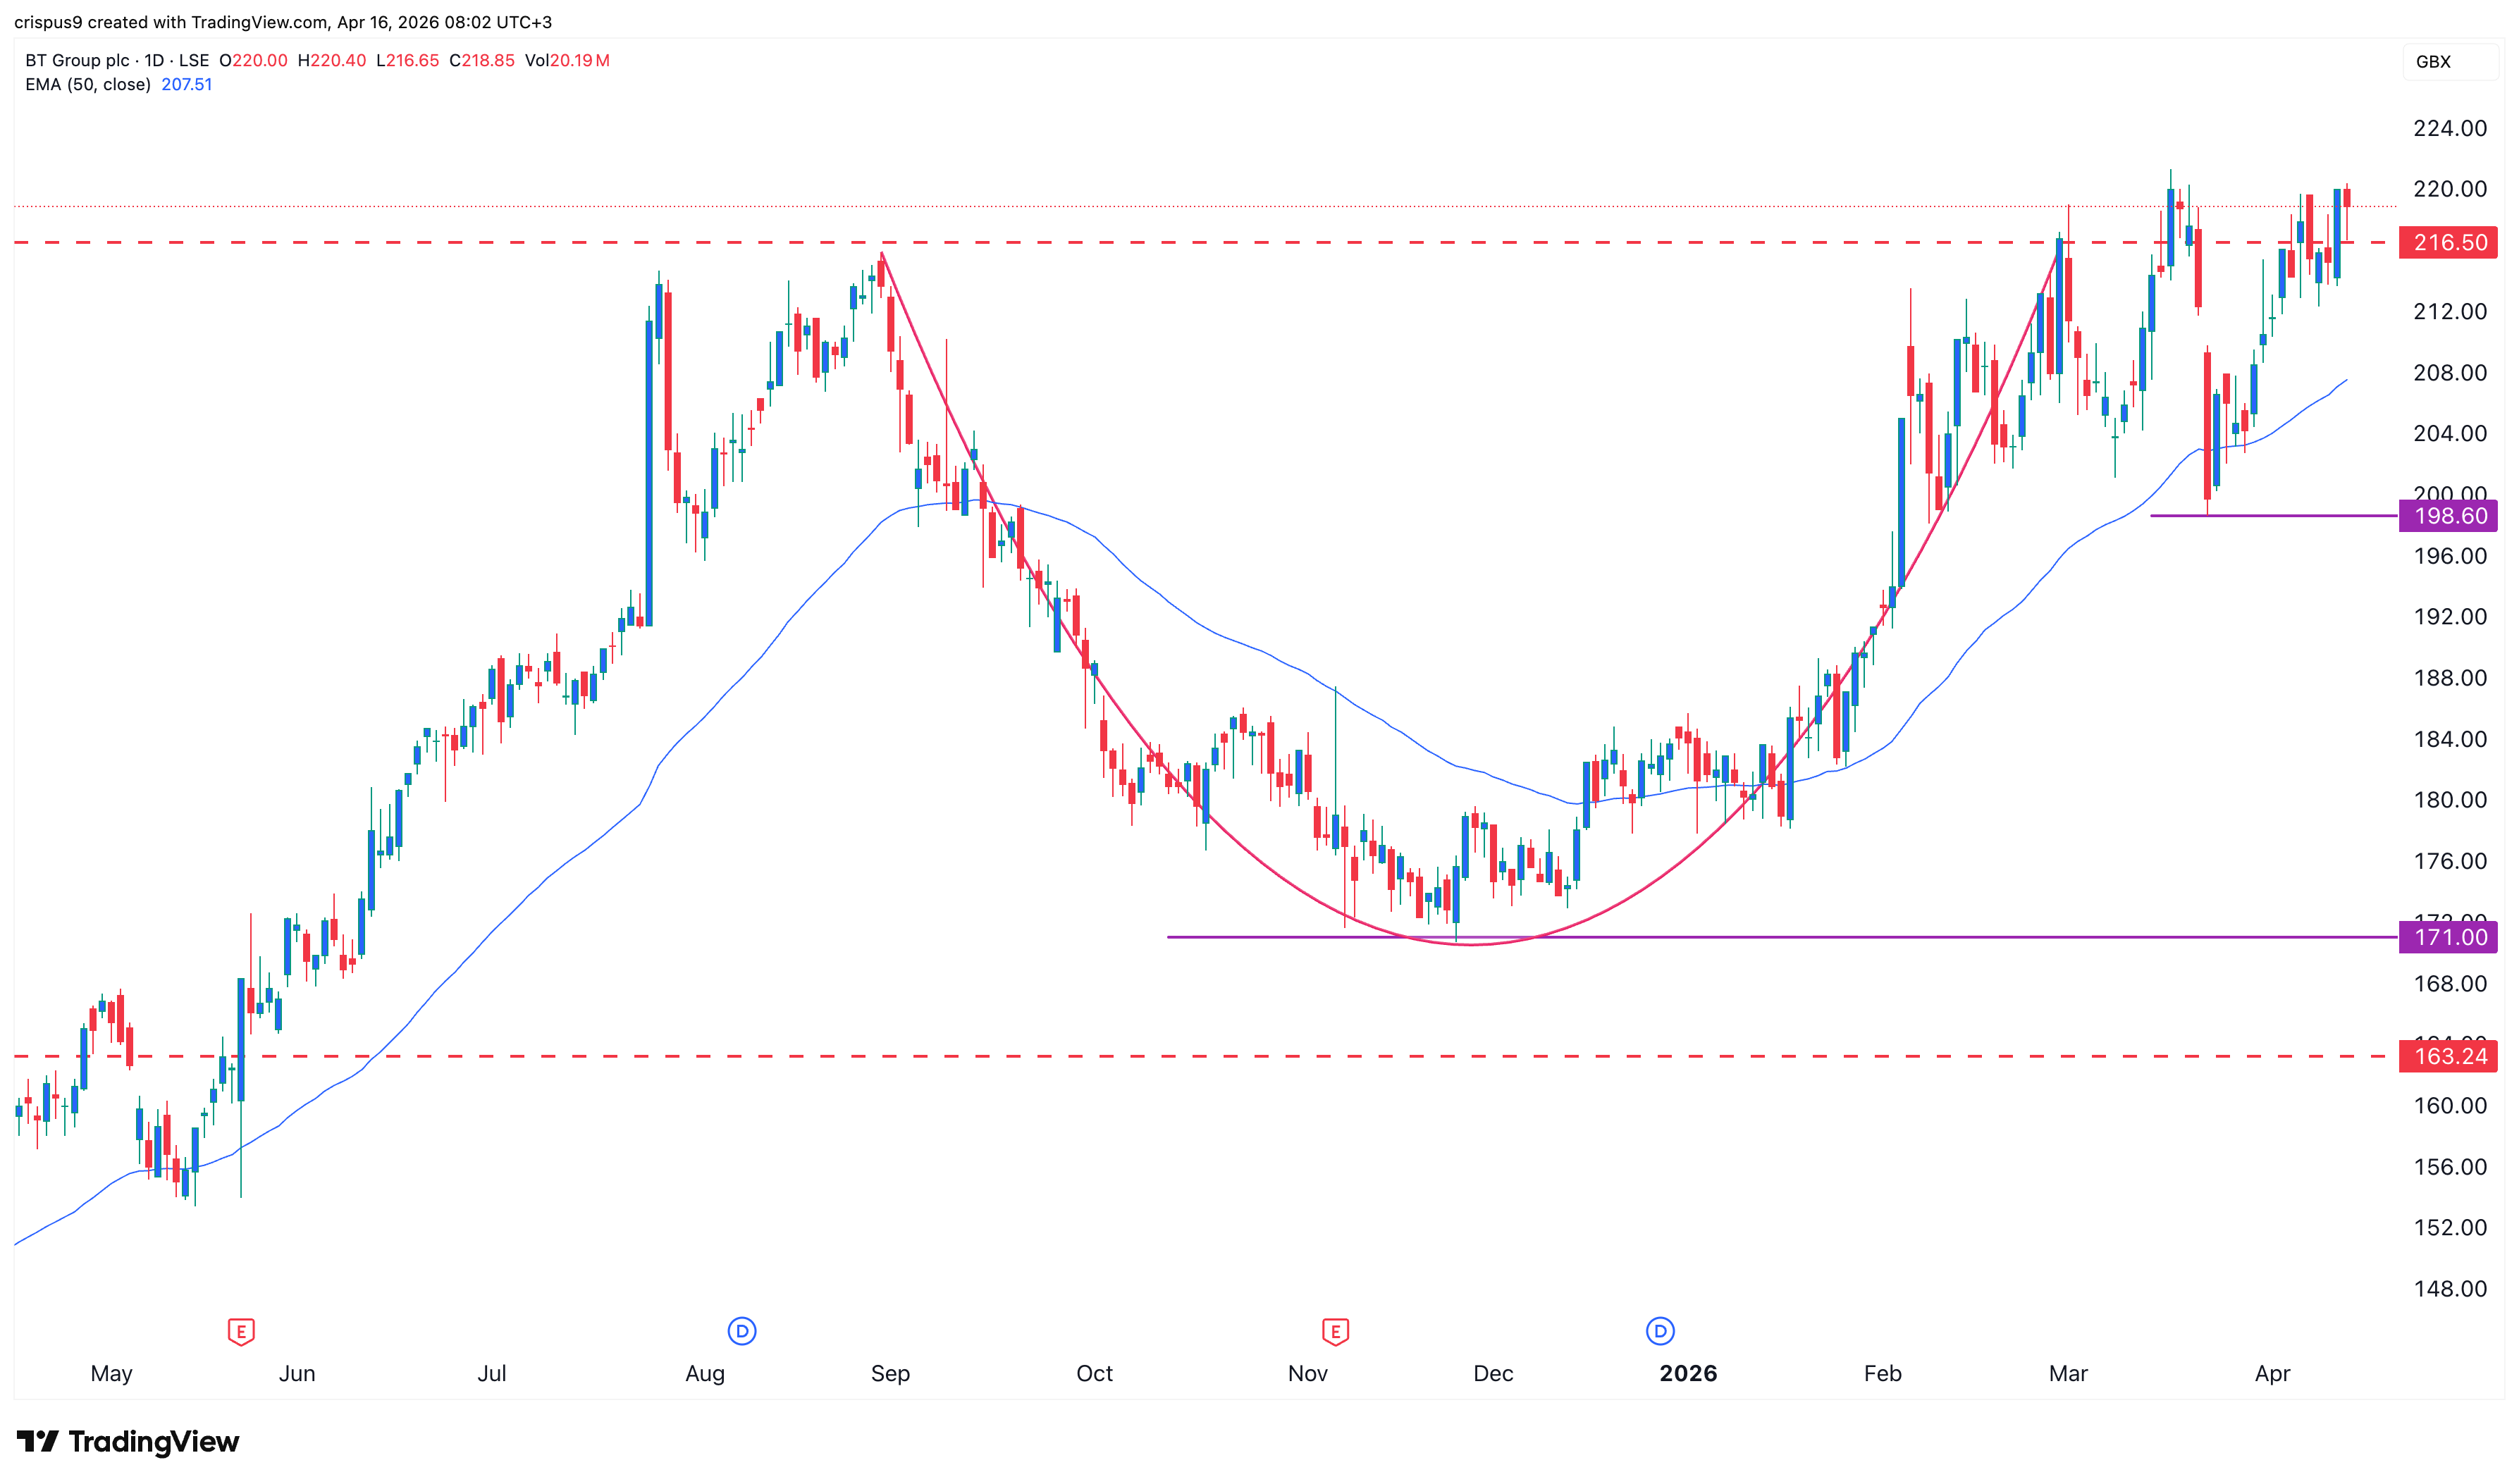
BT Group stock chart | Source: TradingView
BT Group business continues to grind as challenges remain
The most recent results showed that BT Group continued to experience major headwinds as more consumers abandoned its broadband solutions, albeit at a lower pace than expected.
This slowdown has been offset by its fibre business, which has continued to add thousands of clients, and is now serving over 21 million customers. Its broadband lines dropped by 210k in the last quarter, with the full-year losses expected at 850k.
The results showed that its revenue dropped by 4% in the third quarter to £4.97 billion, with all its businesses seeing a deceleration. BT Business solutions has been the main laggard for years as companies found alternatives.
BT’s international business also continued to deteriorate, with its revenue falling by 14% to £522 million. It dropped by 3% in the first nine months of the year to £3.8 billion.
Looking ahead, BT Group’s business is not expected to grow in the foreseeable future. For example, the latest consensus is that its annual revenue for FY’26 will be £19.6 billion, down by 3.4% YoY. It will then drop by 1.8% in FY’27 to £19.3 billion.
On the positive side, the management’s efforts to boost profitability will start showing results. This means that its EBITDA will be £8.21 billion in the coming report followed by £8.255 billion next year and £8.3 billion in the following year.
These efforts explain why the stock has continued to do fairly well amid the ongoing revenue deceleration. Another reason is that the dividend per share is expected to keep rising from 8.39p in FY’26 to 9.05p in FY’28.
The post Here’s why BT Group share price is set to soar despite Broadband lossses appeared first on Invezz
Predictions Markets
See what traders are focused on
Share:
Predictions Markets
See what traders are focused on
Share:
Read More

US Retail Stock Buying Slumps to Lowest Level Since Early 2020