WTI Gap Fill Opportunity: Asymmetric Risk/Reward Setup Explained
Share:
WTI crude formed a chart gap that analysts say could be filled, creating an asymmetric risk/reward trade example with a 1:4 ratio (stop-loss $0.50, target $2.00) amid volatility driven by supply-demand, geopolitics and macro data. Traders should monitor the gap as a potential catalyst for a short-term bounce or trend continuation, and the setup’s risk-management lessons are transferable to crypto, DeFi and CEX/DEX trading, but the signal is not guaranteed.
Predictions Markets
See what traders are focused on

BitcoinWorld
WTI Gap Fill Opportunity: Asymmetric Risk/Reward Setup Explained
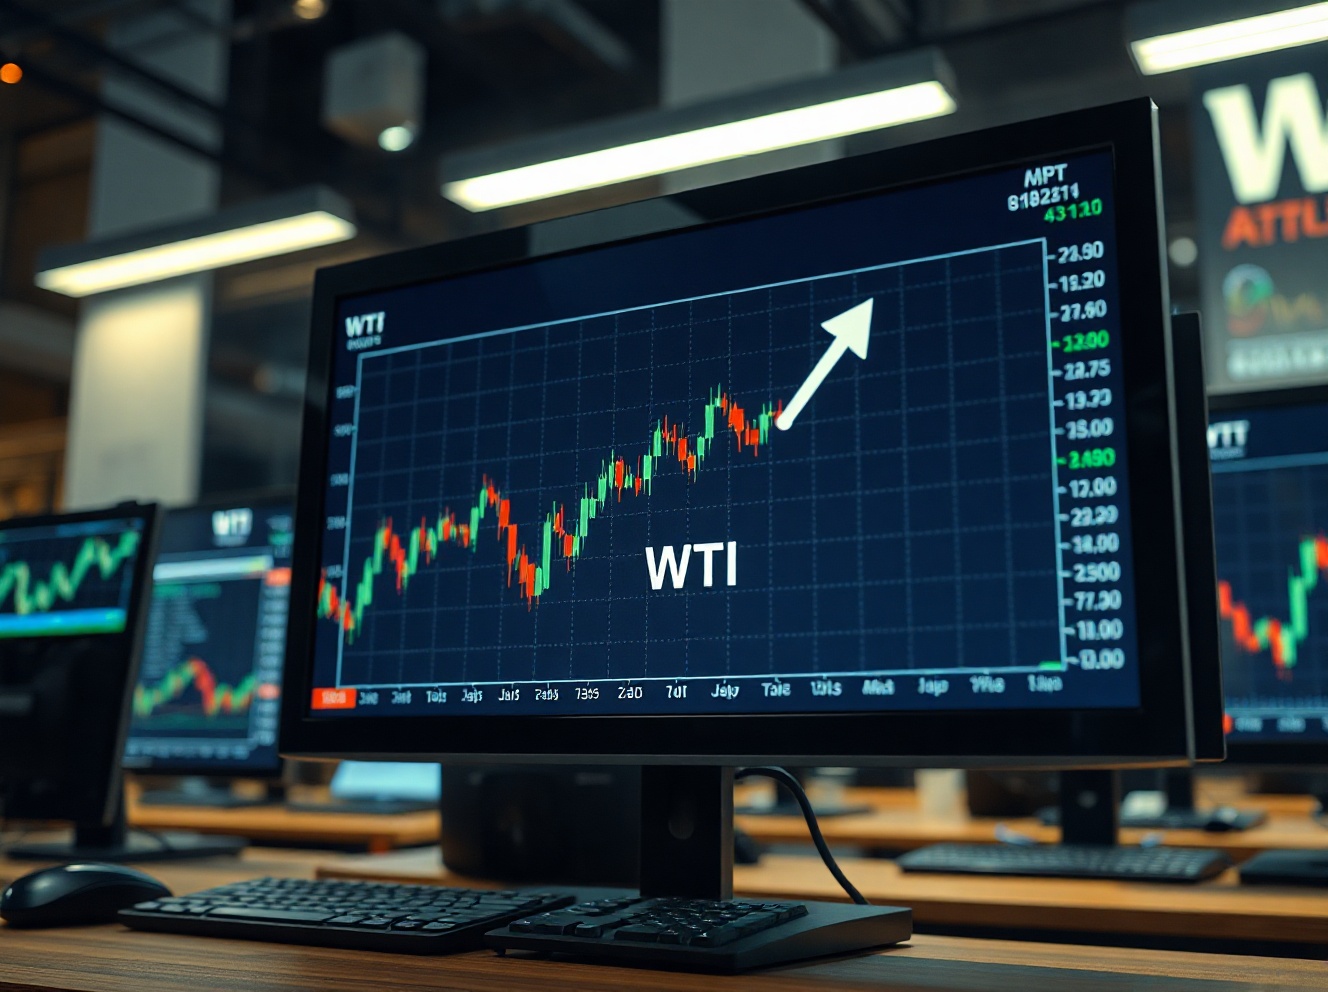
WTI crude oil futures have formed a price gap on the charts, presenting traders with a potential gap-fill opportunity that offers an asymmetric risk/reward profile, as highlighted in a recent technical analysis video.
Understanding the Gap Fill Setup
The gap in question refers to a price level where WTI futures jumped or fell sharply, leaving a void on the candlestick chart. In technical analysis, gaps often act as magnets, with prices tending to fill them before continuing the prevailing trend. The current setup suggests that the price may retrace to fill this gap, offering a favorable entry point for traders who anticipate a move back to that level.
The ‘asymmetric risk/reward’ label implies that the potential profit from this trade significantly outweighs the potential loss. For instance, a trader might set a stop-loss just beyond the gap, while targeting a profit level much further away, creating a ratio that justifies the trade from a risk management perspective.
Market Context and Implications
This technical pattern emerges amid ongoing volatility in the oil market, driven by supply-demand dynamics, geopolitical tensions, and macroeconomic data. As of the latest trading session, WTI crude is hovering near key support levels, and the gap fill could serve as a catalyst for a short-term bounce or a continuation of the broader trend.
For traders and investors, understanding this setup is crucial because it highlights a concrete price level to watch. A successful gap fill could signal a shift in market sentiment, while a failure to fill might indicate a strong trend that could lead to further price movement. The video analysis provides a visual walkthrough, making it easier for viewers to grasp the technical nuances.
Why This Matters for Oil Market Participants
This analysis is particularly relevant for active traders and energy sector investors who rely on technical patterns to time their entries and exits. The asymmetric risk/reward profile is a core concept in trading, and this specific WTI setup offers a clear example of how to apply it in practice. By identifying the gap and its potential fill, traders can better manage their positions and capitalize on short-term price movements.
Conclusion
In summary, the WTI gap fill opportunity presents a compelling technical setup with an asymmetric risk/reward ratio. Traders should monitor the price action around the gap level and consider this pattern in their broader market analysis. As always, it’s essential to combine technical signals with fundamental research and risk management strategies.
FAQs
Q1: What is a gap fill in trading?
A gap fill occurs when the price of an asset moves back to a level where a previous gap was created on a chart. Gaps are areas where the price jumped sharply, and they often act as support or resistance levels.
Q2: How does asymmetric risk/reward work?
Asymmetric risk/reward means that the potential profit of a trade is significantly larger than the potential loss. For example, a trade might have a stop-loss at $0.50 per barrel and a target profit of $2.00, creating a 1:4 risk/reward ratio.
Q3: Is this a guaranteed trade?
No, technical analysis is not foolproof. While the gap fill pattern has historical reliability, it is not guaranteed. Traders should use stop-loss orders and position sizing to manage risk.
This post WTI Gap Fill Opportunity: Asymmetric Risk/Reward Setup Explained first appeared on BitcoinWorld.

Read More

WTI Price Forecast: Critical $77 Support Holds the Line – Breakdown Risks Further Decline