


Bitcoin ETF Performance: A Detailed Insight into Futures and Spot Markets
The post Bitcoin ETF Performance: A Detailed Insight into Futures and Spot Markets appeared first on Coinpedia Fintech News
Bitcoin ETFs are making waves right now, with the US SEC recently greenlighting around 11 Bitcoin Spot ETFs, including those from BlockRock, Fidelity and Invesco.
In this report, we delve into a comprehensive analysis of how Bitcoin ETFs have performed this month, using top-notch data sources. Our focus is not just on spot ETFs but also extends to Bitcoin Futures ETFs. Join us as we explore the performance trends, offering a detailed look at the current state of Bitcoin ETFs in the market.
This monthly report aims to provide a clear and straightforward understanding of the latest developments in the world of Bitcoin Exchange-Traded Funds.
1. Bitcoin Futures ETF In-Depth Analysis
At the time of writing this report, ProShare, Valkyrie, Global X and Ark/21 Shares are the top players in the Bitcoin Futures ETF market, on the basis of Asset Under Management.
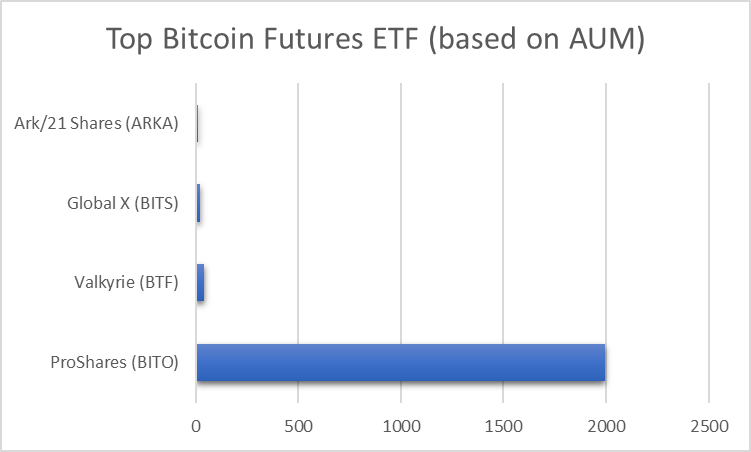
| Bitcoin Futures ETF | AUM |
| ProShares (BITO) | $1,996.9M |
| Valkyrie (BTF) | $41.8M |
| Global X (BITS) | $22.1M |
| Ark/21 Shares (ARKA) | $12.8M |
Let’s analyse these top players deeply using various parameters.
1.1. Bitcoin Futures ETF: A Basic Data Overview
This basic data overview gives an overall picture of the top player’s performance.
| Bitcoin Futures ETF | Price | Volume | 1 Month Average Volume | AUM | Shares |
| ProShares (BITO) | $24.66 | 13,097,000 | 16,234,212 | $1,996.9M | 85.2M |
| Valkyrie (BTF) | $16.86 | 74,000 | 76,392 | $41.8M | 2.6M |
| Global X (BITS) | $60.70 | 8,900 | 9,375 | $22.1M | 0.4M |
| Ark/21 Shares (ARKA) | $51.23 | 9,600 | 7,350 | $12.8M | 0.3M |
Let’s go beyond what the basic data communicates.
1.2. Bitcoin Futures ETF Monthly Average Volume Analysis
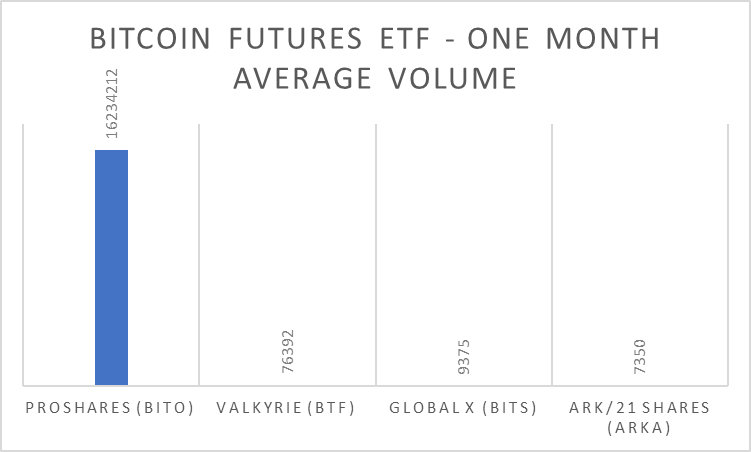
| Bitcoin Futures ETF | 1 Month Average Volume |
| ProShares (BITO) | 16,234,212 |
| Valkyrie (BTF) | 76,392 |
| Global X (BITS) | 9,375 |
| Ark/21 Shares (ARKA) | 7,350 |
The top four Bitcoin Futures ETFs’ one-month average volume provides insights into their market activity and liquidity. ProShares (BITO) leads with a substantially higher volume, indicating greater investor interest and potentially smoother trading. Valkyrie (BTF) follows suit with moderate volume, suggesting steady market participation. However, Global X (BITS) and Ark/21 Shares (ARKA) exhibit lower volumes, implying less liquidity and potentially higher volatility.
1.3. Bitcoin Futures ETF Expense Ratio Analysis
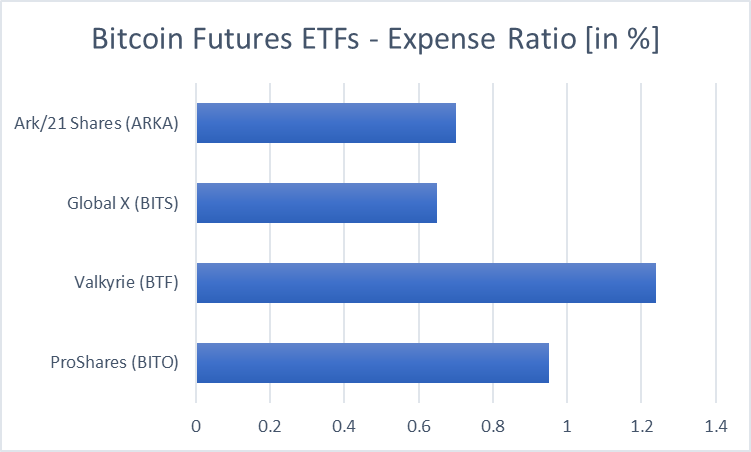
| Bitcoin Futures ETF | Expense Ratio |
| ProShares (BITO) | 0.95% |
| Valkyrie (BTF) | 1.24% |
| Global X (BITS) | 0.65% |
| Ark/21 Shares (ARKA) | 0.70% |
The top four Bitcoin Futures ETFs’ expense ratios vary, with Valkyrie (BTF) having the highest at 1.24% and Global X (BITS) the lowest at 0.65, among the top four ETFs. Expense ratio reflects the percentage of assets deducted annually for fund expenses, impacting investor’s returns. Higher ratios like BTF may eat into profits more significantly over time, while lower ratios like BITS may offer cost efficiency.
1.4. Bitcoin Futures ETF Performance Analysis
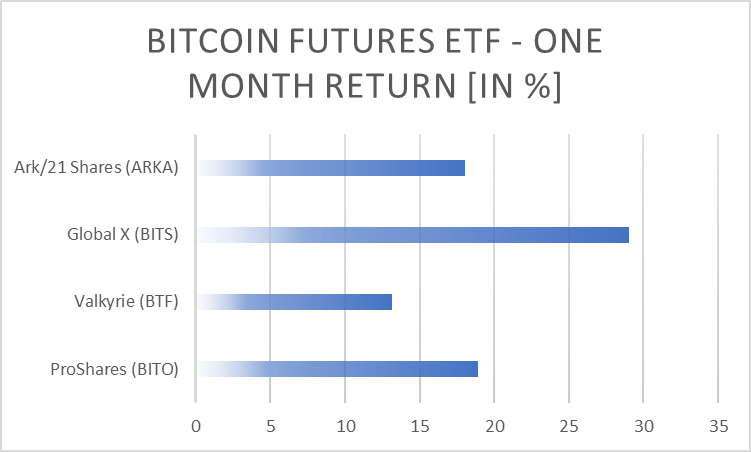
| Bitcoin Futures ETF | 1 Month Return |
| ProShares (BITO) | 18.91% |
| Valkyrie (BTF) | 13.14% |
| Global X (BITS) | 29.05% |
| Ark/21 Shares (ARKA) | 18.01% |
The top four Bitcoin Futures ETFs’ one month returns vary significantly. Global X (BITS) demonstrates the highest return of 29.05%, potentially indicating strong performance but also higher volatility. ProShares (BITO) follows with 18.91%, while Ark/21 Shares (ARKA) and Valkyrie (BTF) show returns of 18.01% and 13.14% respectively. Higher returns may signal higher risk and potential rewards, while lower returns might imply steadier but possibly slower growth.
1.5. Bitcoin Futures ETF One Month Net Fund Flow Analysis
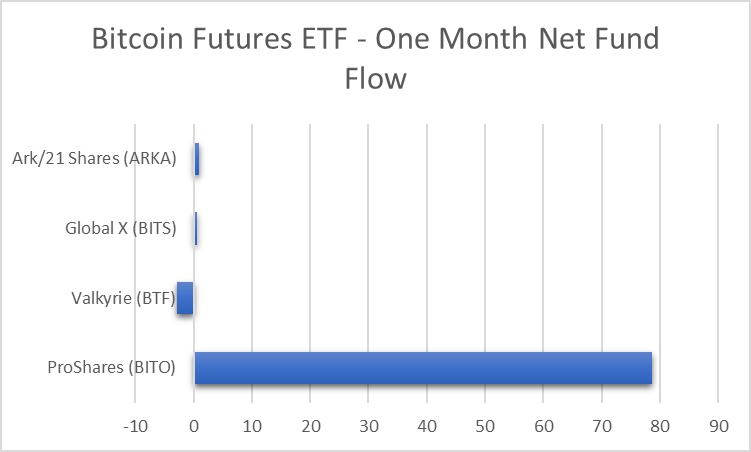
| Bitcoin Futures ETF | One Month Net Fund Flow |
| ProShares (BITO) | 78.62M |
| Valkyrie (BTF) | -2.9M |
| Global X (BITS) | 0.595M |
| Ark/21 Shares (ARKA) | 1.01M |
The Top Four Bitcoin Futures ETFs’ one-month net fund flow indicates sentiment towards each fund. ProShares (BITO) leads with a positive flow of $78.62 million, suggesting strong investor interest and potential confidence in the fund’s performance. Ark/21 Shares (ARKA) follows with a smaller positive flow, while Global X (BITS) shows modest inflows. However, Valkyrie (BTF) experiences a negative flow of -$2.9 million, possibly indicating investor withdrawals or decreased confidence.
1.6. Bitcoin Futures ETF Technical Analysis
| Bitcoin Futures ETF | Price | 20 Day Volatility | RSI (30 Days) | 20 Day Moving Average | MACD (15 Days) | Williams % Range (20 Days) |
| ProShares (BITO) | $24.66 | 40.92% | 65 | $21.19 | 2.71 | 7.33 |
| Valkyrie (BTF) | $16.86 | 43.24% | 64 | $14.11 | 1.75 | 8.94 |
| Global X (BITS) | $60.70 | 62.62% | 64 | $50.20 | 10.16 | 10.17 |
| Ark/21 Shares (ARKA) | $51.23 | 41.79% | 65 | $44.09 | 5.50 | 7.79 |
In analysing the Top Four Bitcoin Futures ETFs based on the provided data, several technical indicators offer insights into their performance.
Firstly, looking at price levels, Global X (BITS) has the highest price at $60.70, indicating potential strength in the market, while Valkyrie (BTF) has the lowest price at $16.86, possibly indicating a lower market demand.
Secondly, considering volatility, Global X (BITS) also exhibits the highest volatility at 62.62%, suggesting higher price fluctuations compared to others, potentially presenting both increased risks and rewards.
Relative Strength Index (RSI) values for all ETFs are relatively high, indicating that they might be overbought, which could signal a potential reversal in price direction in the near future.
Moving Averages show the average price over 20 days, with Global X (BITS) having the highest average at $50.20, indicating a relatively strong upward trend.
Moving Average Convergence Divergence (MACD) values suggest the direction of the trend, with Global X (BITS) showing the highest value, potentially indicating a strong bullish trend.
William % Range reflects overbought or oversold conditions, with all ETFs indicating relatively high values, suggesting caution as they might be nearing overbought territory.
In short, while Global X (BITS) seems to be exhibiting strong bullish signals with high prices, volatility and MACD values, caution should be exercised due to overbought conditions as indicated by RSI and Williams % Range.
2. Bitcoin Spot ETF In-Depth Analysis
At the time of writing this report, Grayscale Bitcoin Trust, iShare Bitcoin Trust, Wise Origin Bitcoin Trust by Fidelity, Ark/21 Shares Bitcoin Trust, and Bitwise Bitcoin ETP are the top players in the Bitcoin Spot ETF market on the basis of Asset Under Management.
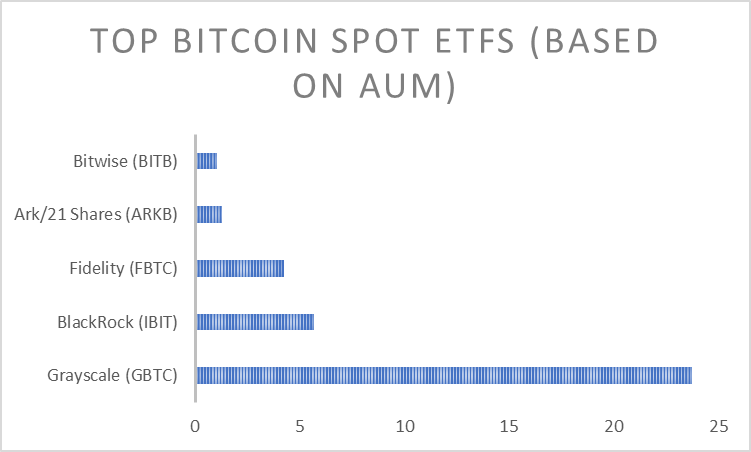
| Bitcoin Spot ETF | AUM |
| Grayscale (GBTC) | 23.76B |
| BlackRock (IBIT) | 5.68B |
| Fidelity (FBTC) | 4.25B |
| Ark/21 Shares (ARKB) | 1.29B |
| Bitwise (BITB) | 1.03B |
Let’s analyse these top players using various parameters.
2.1. Bitcoin Spot ETF: A Basic Data Overview
This basic data overview offers an overall picture of the top player’s performance.
| Bitcoin Spot ETF | Price | Volume | 1 Month Average Volume | AUM | Shares |
| Grayscale (GBTC) | $46.41 | 13,357,301 | 16,215,621 | $23.76B | 514.5M |
| BlackRock (IBIT) | $29.67 | 21,166,400 | 16,585,666 | $5.68B | 203.6M |
| Fidelity (FBTC) | $45.52 | 7,629,300 | 7,817,521 | $4.25B | 87.4M |
| Ark/21 Shares (ARKB) | $52.08 | 2,734,200 | 2,282,613 | $1.29B | 26.6M |
| Bitwise (BITB) | $28.37 | 6,324,300 | 2,292,663 | $1.03B | 40.6M |
Let’s go beyond what the basic data conveys.
2.2. Bitcoin Spot ETF Average Volume Analysis
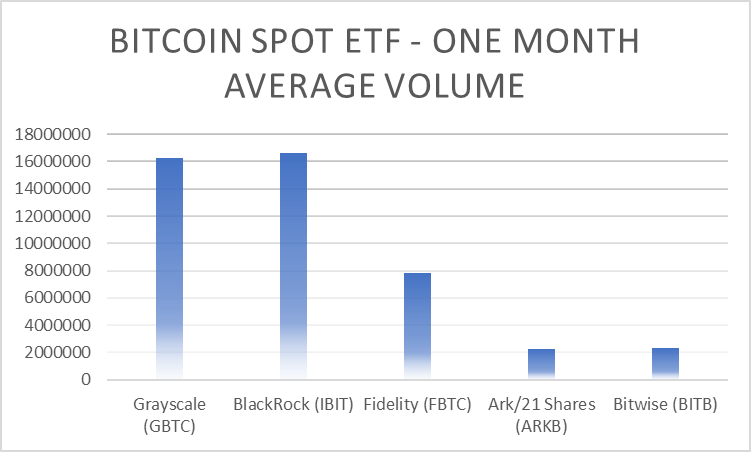
| Bitcoin Spot ETF | 1-Month Average Volume |
| Grayscale (GBTC) | 16,215,621 |
| BlackRock (IBIT) | 16,585,666 |
| Fidelity (FBTC) | 7,817,521 |
| Ark/21 Shares (ARKB) | 2,282,613 |
| Bitwise (BITB) | 2,292,663 |
The top five Bitcoin Spot ETFs’ one month average volume vary significantly. BlackRock (IBIT) and Grayscale (GBTC) lead with high volumes, indicating substantial market participation and potentially higher liquidity. Fidelity (FBTC) follows with moderate volume, while Ark/21 Shares (ARKB) and Bitwise (BITB) show relatively lower volumes. Higher volumes may suggest greater investor interest and confidence in the ETF’s underlying assets, while lower volumes might imply less market activity and potentially higher volatility.
2.3. Bitcoin Spot ETF Expense Ratio Analysis
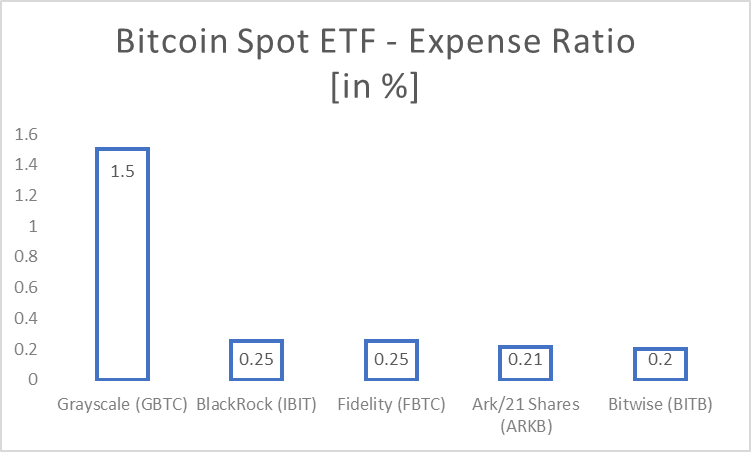
| Bitcoin Spot ETF | Expense Ratio |
| Grayscale (GBTC) | 1.50% |
| BlackRock (IBIT) | 0.25% |
| Fidelity (FBTC) | 0.25% |
| Ark/21 Shares (ARKB) | 0.21% |
| Bitwise (BITB) | 0.20% |
Expense ratio reflects the percentage of assets deducted annually for fund expenses. Lower rations may attract cost-conscious investors, while higher ratios might indicate additional services or higher management fees. The top five Bitcoin Spot ETFs’ expense ratios range from 0.20% to 1.50%. Grayscale (GBTC) has the highest ratio, potentially impacting investor returns more significantly over time. Conversely, Ark/21 Shares (ARKB) and Bitwise (BITB) offer the lowest rations, indicating cost efficiency.
2.4. Bitcoin Spot ETF Performance Analysis
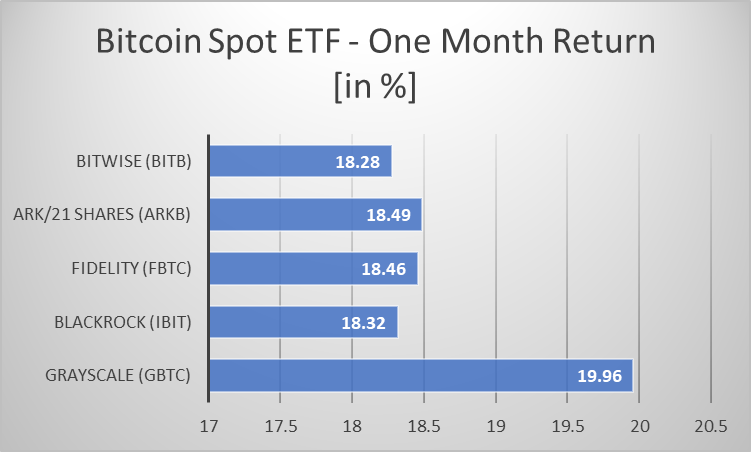
| Bitcoin Spot ETF | One Month Return |
| Grayscale (GBTC) | 19.96% |
| BlackRock (IBIT) | 18.32% |
| Fidelity (FBTC) | 18.46% |
| Ark/21 Shares (ARKB) | 18.49% |
| Bitwise (BITB) | 18.28% |
The top five Bitcoin Spot ETFs’ one month returns cluster closely between 18.28% and 19.96%. Grayscale (GBTC) exhibits the highest return, potentially indicating strong performance. Ark/21 Shares (ARKB), Fidelity (FBTC), BlackRock (IBIT), and Bitwise (BITB) follow closely, showing similar returns. This suggests overall positive performance. Higher returns may signify higher potential rewards.
2.5. Bitcoin Spot ETF Net Fund Flow Analysis
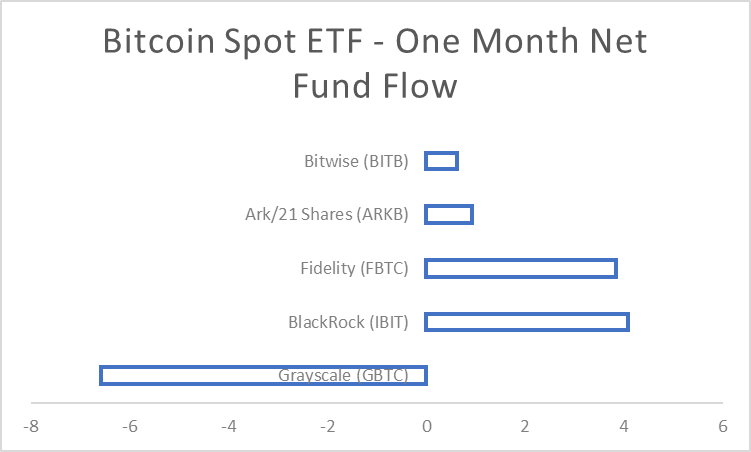
| Bitcoin Spot ETF | 1 Month Net Fund Flow |
| Grayscale (GBTC) | -6.59B |
| BlackRock (IBIT) | 4.09B |
| Fidelity (FBTC) | 3.84B |
| Ark/21 Shares (ARKB) | 0.922B |
| Bitwise (BITB) | 0.622B |
The top five Bitcoin Spot ETF’s one-month net fund flows highlight investor sentiment towards each fund. BlackRock (IBIT) and Fidelity (FBTC) lead with significant inflows of $4.09 billion and $3.84 billion respectively, suggesting strong investor interest. Ark/21 Shares (ARKB) and Bitwise (BITB) follow with smaller positive inflows, indicating continued investor confidence. However, Grayscale (GBTC) experiences a substantial outflow of -$6.59 billion, potentially signalling investor withdrawals or decreased confidence in the fund’s performance.
2.6. Bitcoin Spot ETF Technical Analysis
| Bitcoin Spot ETF | Price | 20 Day Volatility | RSI (20 Days) | 20 Day Moving Average | MACD (15 Days) | Williams % Range (20 Days) |
| Grayscale (GBTC) | $46.41 | 40.61% | 71 | $39.88 | 5.04 | 7.57 |
| BlackRock (IBIT) | $29.67 | 40.58% | 60 | $25.51 | 3.24 | 7.43 |
| Fidelity (FBTC) | $45.52 | 40.89% | 60 | $39.12 | 4.98 | 6.98 |
| Ark/21 Shares (ARKB) | $52.08 | 40.90% | 60 | $44.73 | 5.73 | 6.90 |
| Bitwise (BITB) | $28.37 | 40.21% | 60 | $24.39 | 3.13 | 6.78 |
Analysing the top five Bitcoin Spot ETFs based on the provided data reveals insights into their technical performance.
Ark/21 Shares (ARKB) boasts the highest price among the ETFs at $52.08, indicating potential market strength. However, Grayscale (GBTC) closely follows with a price of $46.41, suggesting competitive market demand.
Volatility, represented by the 20-day volatility metric, is relatively consistent across all the top five ETFs, ranging from 40.21% (Bitwise – BITB) to 40.90% (Ark/21 Shares – ARKB), implying similar levels of price fluctuations.
Relative Strength Index (RSI) values provide insights into the momentum of price movements. Grayscale (GBTC) stands out with an RSI of 71, indicating potential overbought conditions, while others hover around 60, suggesting strong bullish momentum but with less extreme levels.
Moving Averages, particularly the 20-day moving average, reflect the trend direction. Ark/21 Shares (ARKB) again leads with the highest average at $44.73, indicating a strong uptrend.
MACD values indicate the strength and direction of the trend, with Ark/21 Shares (ARKB) exhibiting the highest value at 5.73, reinforcing its bullish momentum.
Williams % Range values suggest potential overbought or oversold conditions, While all the top ETFs show relatively low values, caution may be warranted, particularly for Grayscale (GBTC), given its highest RSI.
In summary, while Ark/21 Shares (ARKB) demonstrates strong bullish signals across multiple indicators, caution is advised due to potential overbought conditions. Oher ETFs display similar trends but with varying degrees of strength, providing opportunities for investors to diversify their portfolios.
The report offers a clear picture of all the major developments in the Bitcoin ETF market. What makes the report special is it not only explores the developments in the Bitcoin Futures ETF market, but also covers the movements in the Bitcoin Spot ETF market. The quality of the report is promised by the trustworthy sources from which the data is sourced.
Read More


Bitcoin ETF Performance: A Detailed Insight into Futures and Spot Markets
The post Bitcoin ETF Performance: A Detailed Insight into Futures and Spot Markets appeared first on Coinpedia Fintech News
Bitcoin ETFs are making waves right now, with the US SEC recently greenlighting around 11 Bitcoin Spot ETFs, including those from BlockRock, Fidelity and Invesco.
In this report, we delve into a comprehensive analysis of how Bitcoin ETFs have performed this month, using top-notch data sources. Our focus is not just on spot ETFs but also extends to Bitcoin Futures ETFs. Join us as we explore the performance trends, offering a detailed look at the current state of Bitcoin ETFs in the market.
This monthly report aims to provide a clear and straightforward understanding of the latest developments in the world of Bitcoin Exchange-Traded Funds.
1. Bitcoin Futures ETF In-Depth Analysis
At the time of writing this report, ProShare, Valkyrie, Global X and Ark/21 Shares are the top players in the Bitcoin Futures ETF market, on the basis of Asset Under Management.
| Bitcoin Futures ETF | AUM |
| ProShares (BITO) | $1,996.9M |
| Valkyrie (BTF) | $41.8M |
| Global X (BITS) | $22.1M |
| Ark/21 Shares (ARKA) | $12.8M |
Let’s analyse these top players deeply using various parameters.
1.1. Bitcoin Futures ETF: A Basic Data Overview
This basic data overview gives an overall picture of the top player’s performance.
| Bitcoin Futures ETF | Price | Volume | 1 Month Average Volume | AUM | Shares |
| ProShares (BITO) | $24.66 | 13,097,000 | 16,234,212 | $1,996.9M | 85.2M |
| Valkyrie (BTF) | $16.86 | 74,000 | 76,392 | $41.8M | 2.6M |
| Global X (BITS) | $60.70 | 8,900 | 9,375 | $22.1M | 0.4M |
| Ark/21 Shares (ARKA) | $51.23 | 9,600 | 7,350 | $12.8M | 0.3M |
Let’s go beyond what the basic data communicates.
1.2. Bitcoin Futures ETF Monthly Average Volume Analysis
| Bitcoin Futures ETF | 1 Month Average Volume |
| ProShares (BITO) | 16,234,212 |
| Valkyrie (BTF) | 76,392 |
| Global X (BITS) | 9,375 |
| Ark/21 Shares (ARKA) | 7,350 |
The top four Bitcoin Futures ETFs’ one-month average volume provides insights into their market activity and liquidity. ProShares (BITO) leads with a substantially higher volume, indicating greater investor interest and potentially smoother trading. Valkyrie (BTF) follows suit with moderate volume, suggesting steady market participation. However, Global X (BITS) and Ark/21 Shares (ARKA) exhibit lower volumes, implying less liquidity and potentially higher volatility.
1.3. Bitcoin Futures ETF Expense Ratio Analysis
| Bitcoin Futures ETF | Expense Ratio |
| ProShares (BITO) | 0.95% |
| Valkyrie (BTF) | 1.24% |
| Global X (BITS) | 0.65% |
| Ark/21 Shares (ARKA) | 0.70% |
The top four Bitcoin Futures ETFs’ expense ratios vary, with Valkyrie (BTF) having the highest at 1.24% and Global X (BITS) the lowest at 0.65, among the top four ETFs. Expense ratio reflects the percentage of assets deducted annually for fund expenses, impacting investor’s returns. Higher ratios like BTF may eat into profits more significantly over time, while lower ratios like BITS may offer cost efficiency.
1.4. Bitcoin Futures ETF Performance Analysis
| Bitcoin Futures ETF | 1 Month Return |
| ProShares (BITO) | 18.91% |
| Valkyrie (BTF) | 13.14% |
| Global X (BITS) | 29.05% |
| Ark/21 Shares (ARKA) | 18.01% |
The top four Bitcoin Futures ETFs’ one month returns vary significantly. Global X (BITS) demonstrates the highest return of 29.05%, potentially indicating strong performance but also higher volatility. ProShares (BITO) follows with 18.91%, while Ark/21 Shares (ARKA) and Valkyrie (BTF) show returns of 18.01% and 13.14% respectively. Higher returns may signal higher risk and potential rewards, while lower returns might imply steadier but possibly slower growth.
1.5. Bitcoin Futures ETF One Month Net Fund Flow Analysis
| Bitcoin Futures ETF | One Month Net Fund Flow |
| ProShares (BITO) | 78.62M |
| Valkyrie (BTF) | -2.9M |
| Global X (BITS) | 0.595M |
| Ark/21 Shares (ARKA) | 1.01M |
The Top Four Bitcoin Futures ETFs’ one-month net fund flow indicates sentiment towards each fund. ProShares (BITO) leads with a positive flow of $78.62 million, suggesting strong investor interest and potential confidence in the fund’s performance. Ark/21 Shares (ARKA) follows with a smaller positive flow, while Global X (BITS) shows modest inflows. However, Valkyrie (BTF) experiences a negative flow of -$2.9 million, possibly indicating investor withdrawals or decreased confidence.
1.6. Bitcoin Futures ETF Technical Analysis
| Bitcoin Futures ETF | Price | 20 Day Volatility | RSI (30 Days) | 20 Day Moving Average | MACD (15 Days) | Williams % Range (20 Days) |
| ProShares (BITO) | $24.66 | 40.92% | 65 | $21.19 | 2.71 | 7.33 |
| Valkyrie (BTF) | $16.86 | 43.24% | 64 | $14.11 | 1.75 | 8.94 |
| Global X (BITS) | $60.70 | 62.62% | 64 | $50.20 | 10.16 | 10.17 |
| Ark/21 Shares (ARKA) | $51.23 | 41.79% | 65 | $44.09 | 5.50 | 7.79 |
In analysing the Top Four Bitcoin Futures ETFs based on the provided data, several technical indicators offer insights into their performance.
Firstly, looking at price levels, Global X (BITS) has the highest price at $60.70, indicating potential strength in the market, while Valkyrie (BTF) has the lowest price at $16.86, possibly indicating a lower market demand.
Secondly, considering volatility, Global X (BITS) also exhibits the highest volatility at 62.62%, suggesting higher price fluctuations compared to others, potentially presenting both increased risks and rewards.
Relative Strength Index (RSI) values for all ETFs are relatively high, indicating that they might be overbought, which could signal a potential reversal in price direction in the near future.
Moving Averages show the average price over 20 days, with Global X (BITS) having the highest average at $50.20, indicating a relatively strong upward trend.
Moving Average Convergence Divergence (MACD) values suggest the direction of the trend, with Global X (BITS) showing the highest value, potentially indicating a strong bullish trend.
William % Range reflects overbought or oversold conditions, with all ETFs indicating relatively high values, suggesting caution as they might be nearing overbought territory.
In short, while Global X (BITS) seems to be exhibiting strong bullish signals with high prices, volatility and MACD values, caution should be exercised due to overbought conditions as indicated by RSI and Williams % Range.
2. Bitcoin Spot ETF In-Depth Analysis
At the time of writing this report, Grayscale Bitcoin Trust, iShare Bitcoin Trust, Wise Origin Bitcoin Trust by Fidelity, Ark/21 Shares Bitcoin Trust, and Bitwise Bitcoin ETP are the top players in the Bitcoin Spot ETF market on the basis of Asset Under Management.
| Bitcoin Spot ETF | AUM |
| Grayscale (GBTC) | 23.76B |
| BlackRock (IBIT) | 5.68B |
| Fidelity (FBTC) | 4.25B |
| Ark/21 Shares (ARKB) | 1.29B |
| Bitwise (BITB) | 1.03B |
Let’s analyse these top players using various parameters.
2.1. Bitcoin Spot ETF: A Basic Data Overview
This basic data overview offers an overall picture of the top player’s performance.
| Bitcoin Spot ETF | Price | Volume | 1 Month Average Volume | AUM | Shares |
| Grayscale (GBTC) | $46.41 | 13,357,301 | 16,215,621 | $23.76B | 514.5M |
| BlackRock (IBIT) | $29.67 | 21,166,400 | 16,585,666 | $5.68B | 203.6M |
| Fidelity (FBTC) | $45.52 | 7,629,300 | 7,817,521 | $4.25B | 87.4M |
| Ark/21 Shares (ARKB) | $52.08 | 2,734,200 | 2,282,613 | $1.29B | 26.6M |
| Bitwise (BITB) | $28.37 | 6,324,300 | 2,292,663 | $1.03B | 40.6M |
Let’s go beyond what the basic data conveys.
2.2. Bitcoin Spot ETF Average Volume Analysis
| Bitcoin Spot ETF | 1-Month Average Volume |
| Grayscale (GBTC) | 16,215,621 |
| BlackRock (IBIT) | 16,585,666 |
| Fidelity (FBTC) | 7,817,521 |
| Ark/21 Shares (ARKB) | 2,282,613 |
| Bitwise (BITB) | 2,292,663 |
The top five Bitcoin Spot ETFs’ one month average volume vary significantly. BlackRock (IBIT) and Grayscale (GBTC) lead with high volumes, indicating substantial market participation and potentially higher liquidity. Fidelity (FBTC) follows with moderate volume, while Ark/21 Shares (ARKB) and Bitwise (BITB) show relatively lower volumes. Higher volumes may suggest greater investor interest and confidence in the ETF’s underlying assets, while lower volumes might imply less market activity and potentially higher volatility.
2.3. Bitcoin Spot ETF Expense Ratio Analysis
| Bitcoin Spot ETF | Expense Ratio |
| Grayscale (GBTC) | 1.50% |
| BlackRock (IBIT) | 0.25% |
| Fidelity (FBTC) | 0.25% |
| Ark/21 Shares (ARKB) | 0.21% |
| Bitwise (BITB) | 0.20% |
Expense ratio reflects the percentage of assets deducted annually for fund expenses. Lower rations may attract cost-conscious investors, while higher ratios might indicate additional services or higher management fees. The top five Bitcoin Spot ETFs’ expense ratios range from 0.20% to 1.50%. Grayscale (GBTC) has the highest ratio, potentially impacting investor returns more significantly over time. Conversely, Ark/21 Shares (ARKB) and Bitwise (BITB) offer the lowest rations, indicating cost efficiency.
2.4. Bitcoin Spot ETF Performance Analysis
| Bitcoin Spot ETF | One Month Return |
| Grayscale (GBTC) | 19.96% |
| BlackRock (IBIT) | 18.32% |
| Fidelity (FBTC) | 18.46% |
| Ark/21 Shares (ARKB) | 18.49% |
| Bitwise (BITB) | 18.28% |
The top five Bitcoin Spot ETFs’ one month returns cluster closely between 18.28% and 19.96%. Grayscale (GBTC) exhibits the highest return, potentially indicating strong performance. Ark/21 Shares (ARKB), Fidelity (FBTC), BlackRock (IBIT), and Bitwise (BITB) follow closely, showing similar returns. This suggests overall positive performance. Higher returns may signify higher potential rewards.
2.5. Bitcoin Spot ETF Net Fund Flow Analysis
| Bitcoin Spot ETF | 1 Month Net Fund Flow |
| Grayscale (GBTC) | -6.59B |
| BlackRock (IBIT) | 4.09B |
| Fidelity (FBTC) | 3.84B |
| Ark/21 Shares (ARKB) | 0.922B |
| Bitwise (BITB) | 0.622B |
The top five Bitcoin Spot ETF’s one-month net fund flows highlight investor sentiment towards each fund. BlackRock (IBIT) and Fidelity (FBTC) lead with significant inflows of $4.09 billion and $3.84 billion respectively, suggesting strong investor interest. Ark/21 Shares (ARKB) and Bitwise (BITB) follow with smaller positive inflows, indicating continued investor confidence. However, Grayscale (GBTC) experiences a substantial outflow of -$6.59 billion, potentially signalling investor withdrawals or decreased confidence in the fund’s performance.
2.6. Bitcoin Spot ETF Technical Analysis
| Bitcoin Spot ETF | Price | 20 Day Volatility | RSI (20 Days) | 20 Day Moving Average | MACD (15 Days) | Williams % Range (20 Days) |
| Grayscale (GBTC) | $46.41 | 40.61% | 71 | $39.88 | 5.04 | 7.57 |
| BlackRock (IBIT) | $29.67 | 40.58% | 60 | $25.51 | 3.24 | 7.43 |
| Fidelity (FBTC) | $45.52 | 40.89% | 60 | $39.12 | 4.98 | 6.98 |
| Ark/21 Shares (ARKB) | $52.08 | 40.90% | 60 | $44.73 | 5.73 | 6.90 |
| Bitwise (BITB) | $28.37 | 40.21% | 60 | $24.39 | 3.13 | 6.78 |
Analysing the top five Bitcoin Spot ETFs based on the provided data reveals insights into their technical performance.
Ark/21 Shares (ARKB) boasts the highest price among the ETFs at $52.08, indicating potential market strength. However, Grayscale (GBTC) closely follows with a price of $46.41, suggesting competitive market demand.
Volatility, represented by the 20-day volatility metric, is relatively consistent across all the top five ETFs, ranging from 40.21% (Bitwise – BITB) to 40.90% (Ark/21 Shares – ARKB), implying similar levels of price fluctuations.
Relative Strength Index (RSI) values provide insights into the momentum of price movements. Grayscale (GBTC) stands out with an RSI of 71, indicating potential overbought conditions, while others hover around 60, suggesting strong bullish momentum but with less extreme levels.
Moving Averages, particularly the 20-day moving average, reflect the trend direction. Ark/21 Shares (ARKB) again leads with the highest average at $44.73, indicating a strong uptrend.
MACD values indicate the strength and direction of the trend, with Ark/21 Shares (ARKB) exhibiting the highest value at 5.73, reinforcing its bullish momentum.
Williams % Range values suggest potential overbought or oversold conditions, While all the top ETFs show relatively low values, caution may be warranted, particularly for Grayscale (GBTC), given its highest RSI.
In summary, while Ark/21 Shares (ARKB) demonstrates strong bullish signals across multiple indicators, caution is advised due to potential overbought conditions. Oher ETFs display similar trends but with varying degrees of strength, providing opportunities for investors to diversify their portfolios.
The report offers a clear picture of all the major developments in the Bitcoin ETF market. What makes the report special is it not only explores the developments in the Bitcoin Futures ETF market, but also covers the movements in the Bitcoin Spot ETF market. The quality of the report is promised by the trustworthy sources from which the data is sourced.
Read More