Here’s Where Support & Resistance Lies For Solana, Based On On-Chain Data
Share:
Predictions Markets
See what traders are focused on

The analytics firm Glassnode has revealed the Solana price levels that could be important to watch, based on on-chain accumulation data.
Solana Cost Basis Distribution Reveals Where Supply Is Most Concentrated
In a new post on X, Glassnode has discussed about the UTXO Realized Price Distribution (URPD) of Solana. The URPD is an indicator that basically tells us about how much of the SOL supply was purchased at which price levels. Naturally, the metric uses the last transaction price of any token in circulation as its cost basis.
First, here is how the URPD looked when the cryptocurrency set its new all-time high (ATH) back in January:
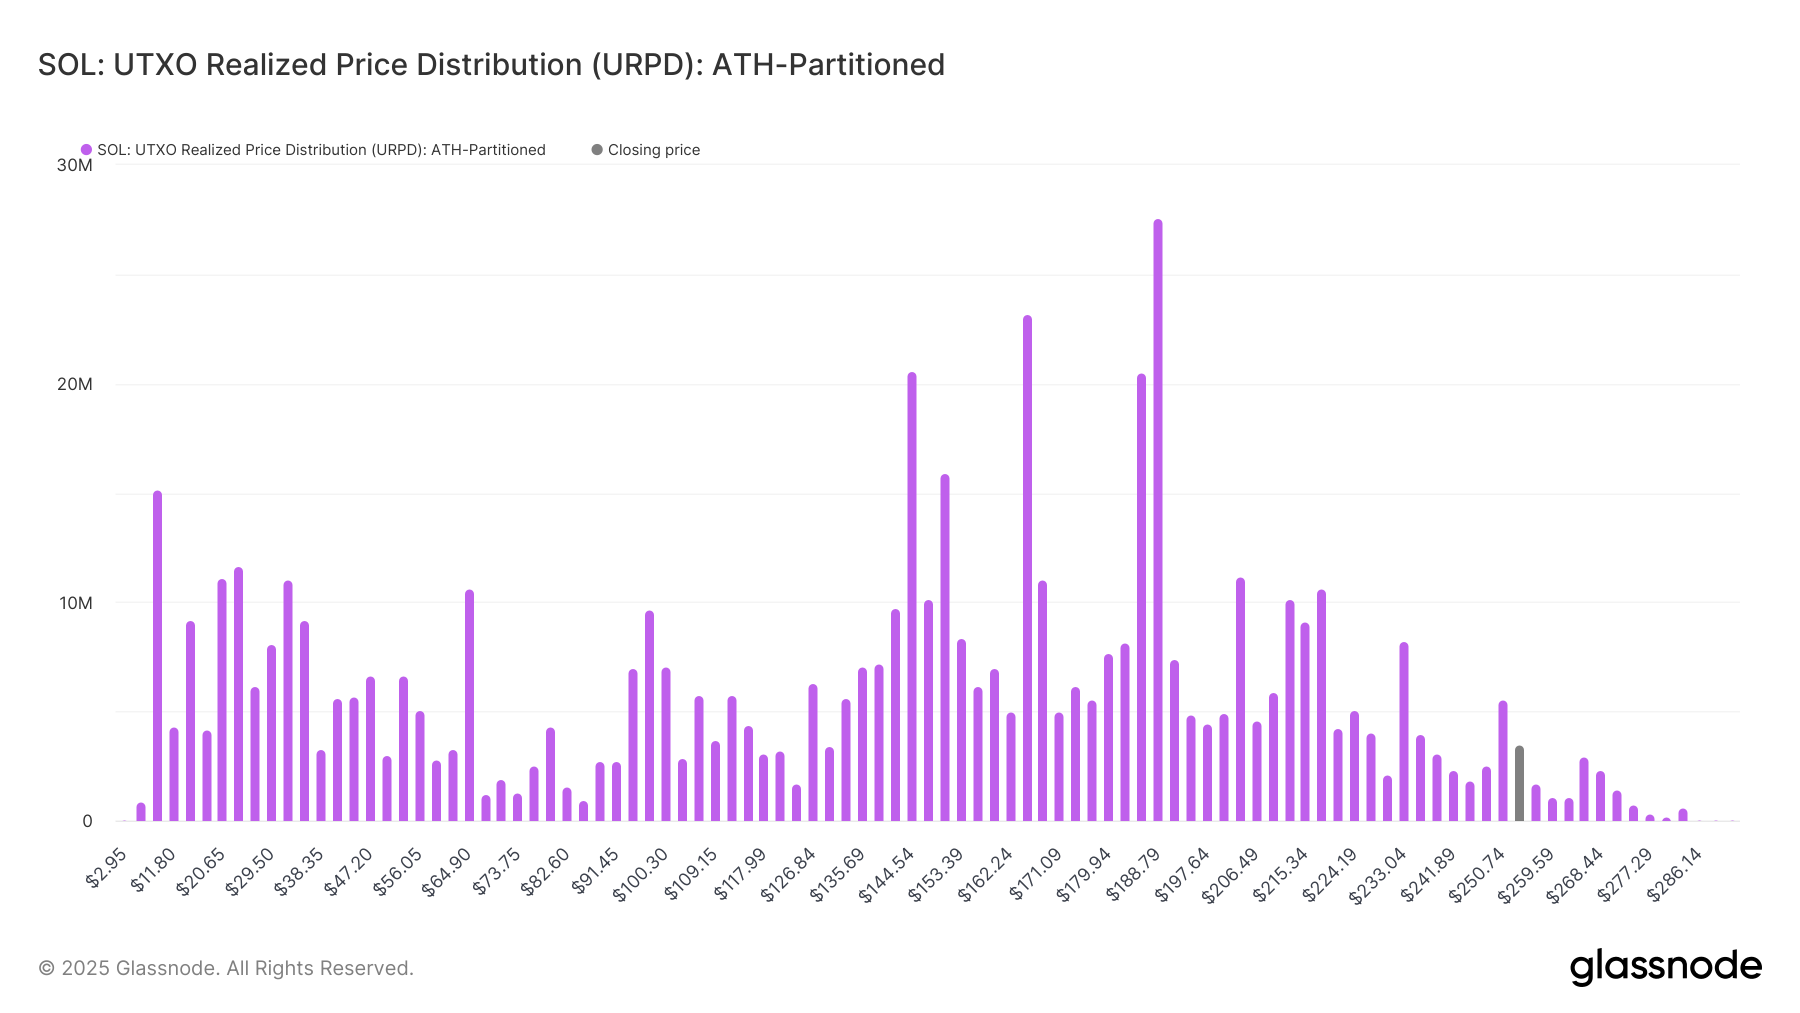
From the graph, it’s apparent that a few price levels like $144 stood out in terms of the amount of supply that they hosted. At the price levels closer to the new ATH, however, supply was quite thin, meaning not many coins changed hands there.
In on-chain analysis, the potential of any level to act as support or resistance is measured in terms of the amount of supply that it hosts. This means that levels that have a large cluster around them on the URPD are the ones of importance to the asset.
As for why this is so, the answer lies in investor psychology: holders are sensitive to retests of their cost basis. Whenever the price touches a large cost basis cluster, the investors who are holding these coins may respond by making some panic moves.
These moves can tend toward buying if the retest is happening from above, as investors may want to defend their profit-loss boundary. In retests happening from below, however, the traders could react by selling instead, as they may seek to exit at their break-even.
When SOL reached its ATH, there was a lack of support nearby. This may be why the asset ended up falling into the cluster that did carry a significant amount of supply. Below is a chart that shows how the URPD has changed following the price drawdown.
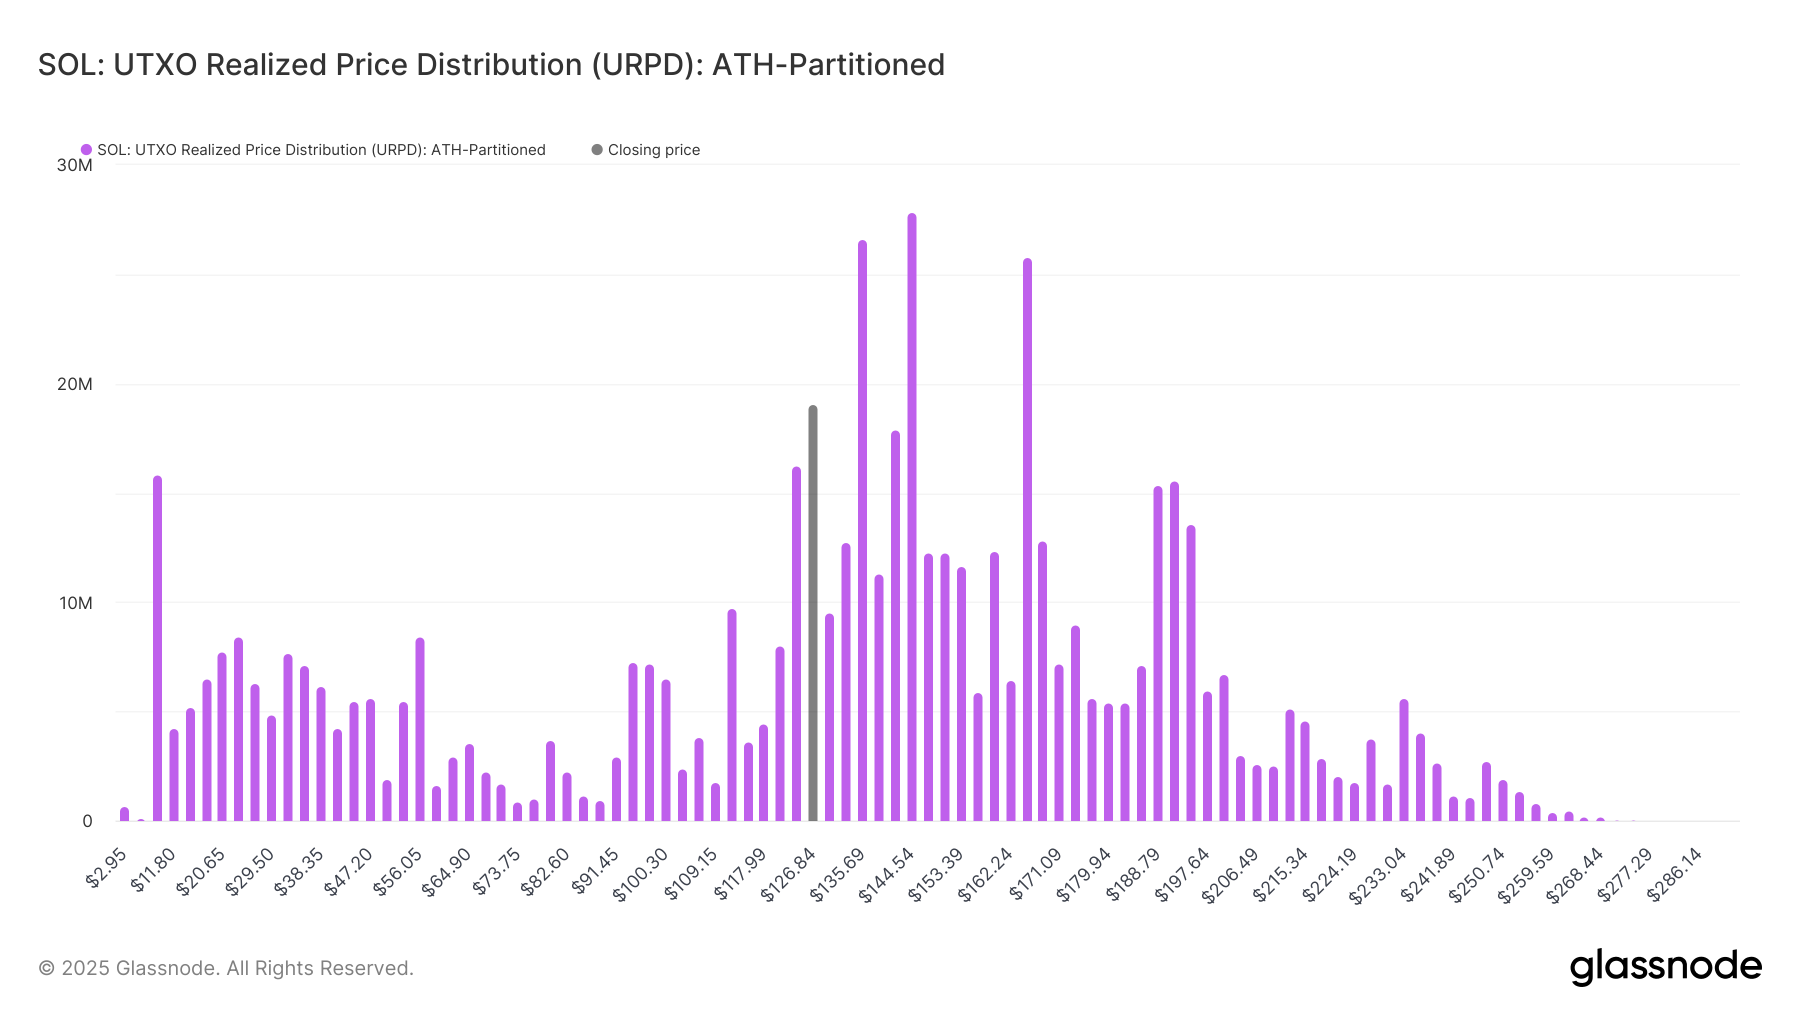
From the graph, it’s visible that if SOL continues its downtrend, it may have to end up relying on the freshly grown $112 level. In January, this level hosted the cost basis of 4 million tokens, but today, the figure has grown to 9.7 million, equivalent to 1.67% of the entire supply.
Beyond this level, Glassnode notes, “$94, $97, and $100 collectively hold nearly 21M SOL (3.5% of supply).” In the scenario that these support levels fail, Solana may find itself in trouble, as there aren’t any major supply clusters until $53.
In terms of the levels above, the $135 and $144 levels stand out, as they hold the acquisition level of 26.6 million and 27 million coins, respectively. These levels could act as major obstacles in SOL’s recovery.
SOL Price
Solana has jumped more than 5% over the last 24 hours to recover to the $130 level.
In This News
Coins

$ 1.78K
+2.72%
$ 1.10
+0.82%
$ 0.00713
+0.17%
$ 0.00...361

$ 0.000399


Predictions Markets
See what traders are focused on
Share:
In This News
Coins
$ 1.78K
+2.72%$ 1.10
+0.82%$ 0.00713
+0.17%$ 0.00...361
$ 0.000399
Predictions Markets
See what traders are focused on
Share:
Read More
Solana (SOL) Hits a Key Decision Zone: Can Buyers Reverse the 5% Slide?