As Blue Owl stock price implodes, is it safe to buy the dip?
Share:
Blue Owl shares plunged from a $25.2 peak to $8.85, wiping out about $28B of market cap (from $41B to $13.3B); firm manages $307B AUM. - Decline driven by private‑credit liquidity/risk concerns: $36M exposure to Century Capital Partners (administration), a suspended fund merger, and expected weaker fundraising this year despite raising $42B last year and reporting Q4 revenue $755M (FY $2.87B). - Technicals and market impact are bearish: head‑and‑shoulders, break below $13.82 neckline, RSI at 24; potential downside to $6.90 but long‑term recovery possible if private‑credit fears abate; keywords: fundraising, liquidity risk, market impact, adoption.
Predictions Markets
See what traders are focused on

Blue Owl stock price has suffered a harsh reversal since last year, erasing billions of dollars in value as the company has moved from one crisis to another. It slumped to $8.85, down sharply from the all-time high of $25.
This retreat has led to a $28 billion wipeout as the market capitalization has dropped from a record high of $41 billion to $13.3 billion. So, will the OWL share price continue falling in the near term or rebound?
Blue Owl stock has crashed due to a series of unfortunate events
OWL stock has plunged in the past few months, falling from a high of $25.2 in January last year to the current $8.8.
This retreat happened as concerns about the private credit industry, where many investors are pulling out their money. This outflow also coincided with the ongoing outflows in other companies like BlackRock's HPS, KKR, and Ares Management.
The company, which now manages over $307 billion in assets under management (AUM), has also been exposed in some major companies and themes. For example, it has a $36 million exposure to Century Capital Partners, a British property lender that filed for administration in February. This filing came a while after MFS, another company did the same.
Blue Owl stock price has also suffered substantial challenges after the company sold funds in a credit fund, a few months after it suspended a merger between a private and publicly traded fund.
Investors now anticipate that the company will see less inflows this year, which will impact its revenue and profitability. The most recent results showed that the company raised $42 billion last year as demand for private credit surged.
The fundraiser was up by 50% from a year earlier, pushing its revenue much higher. It made over $755 million in the fourth quarter, up from $631 million in the same period last year. Its annual revenue jumped to $2.87 billion, up from $2.295 billion in 2024.
Blue Owl’s fundraising will likely be weaker-than-expected this year as concerns about the industry continue. Indeed, recent data show that more institutional investors are no longer investing in private credit as they did in the past few months.
On the positive side, Blue Owl stock has now become a bargain compared to where it was a few months ago. It now trades at a forward price-to-earnings ratio of 9.5, much lower than the S&P 500 Index’s 23. The stock will likely rebound once the ongoing fears in the private credit sector fades.
Blue Owl stock price technical analysis
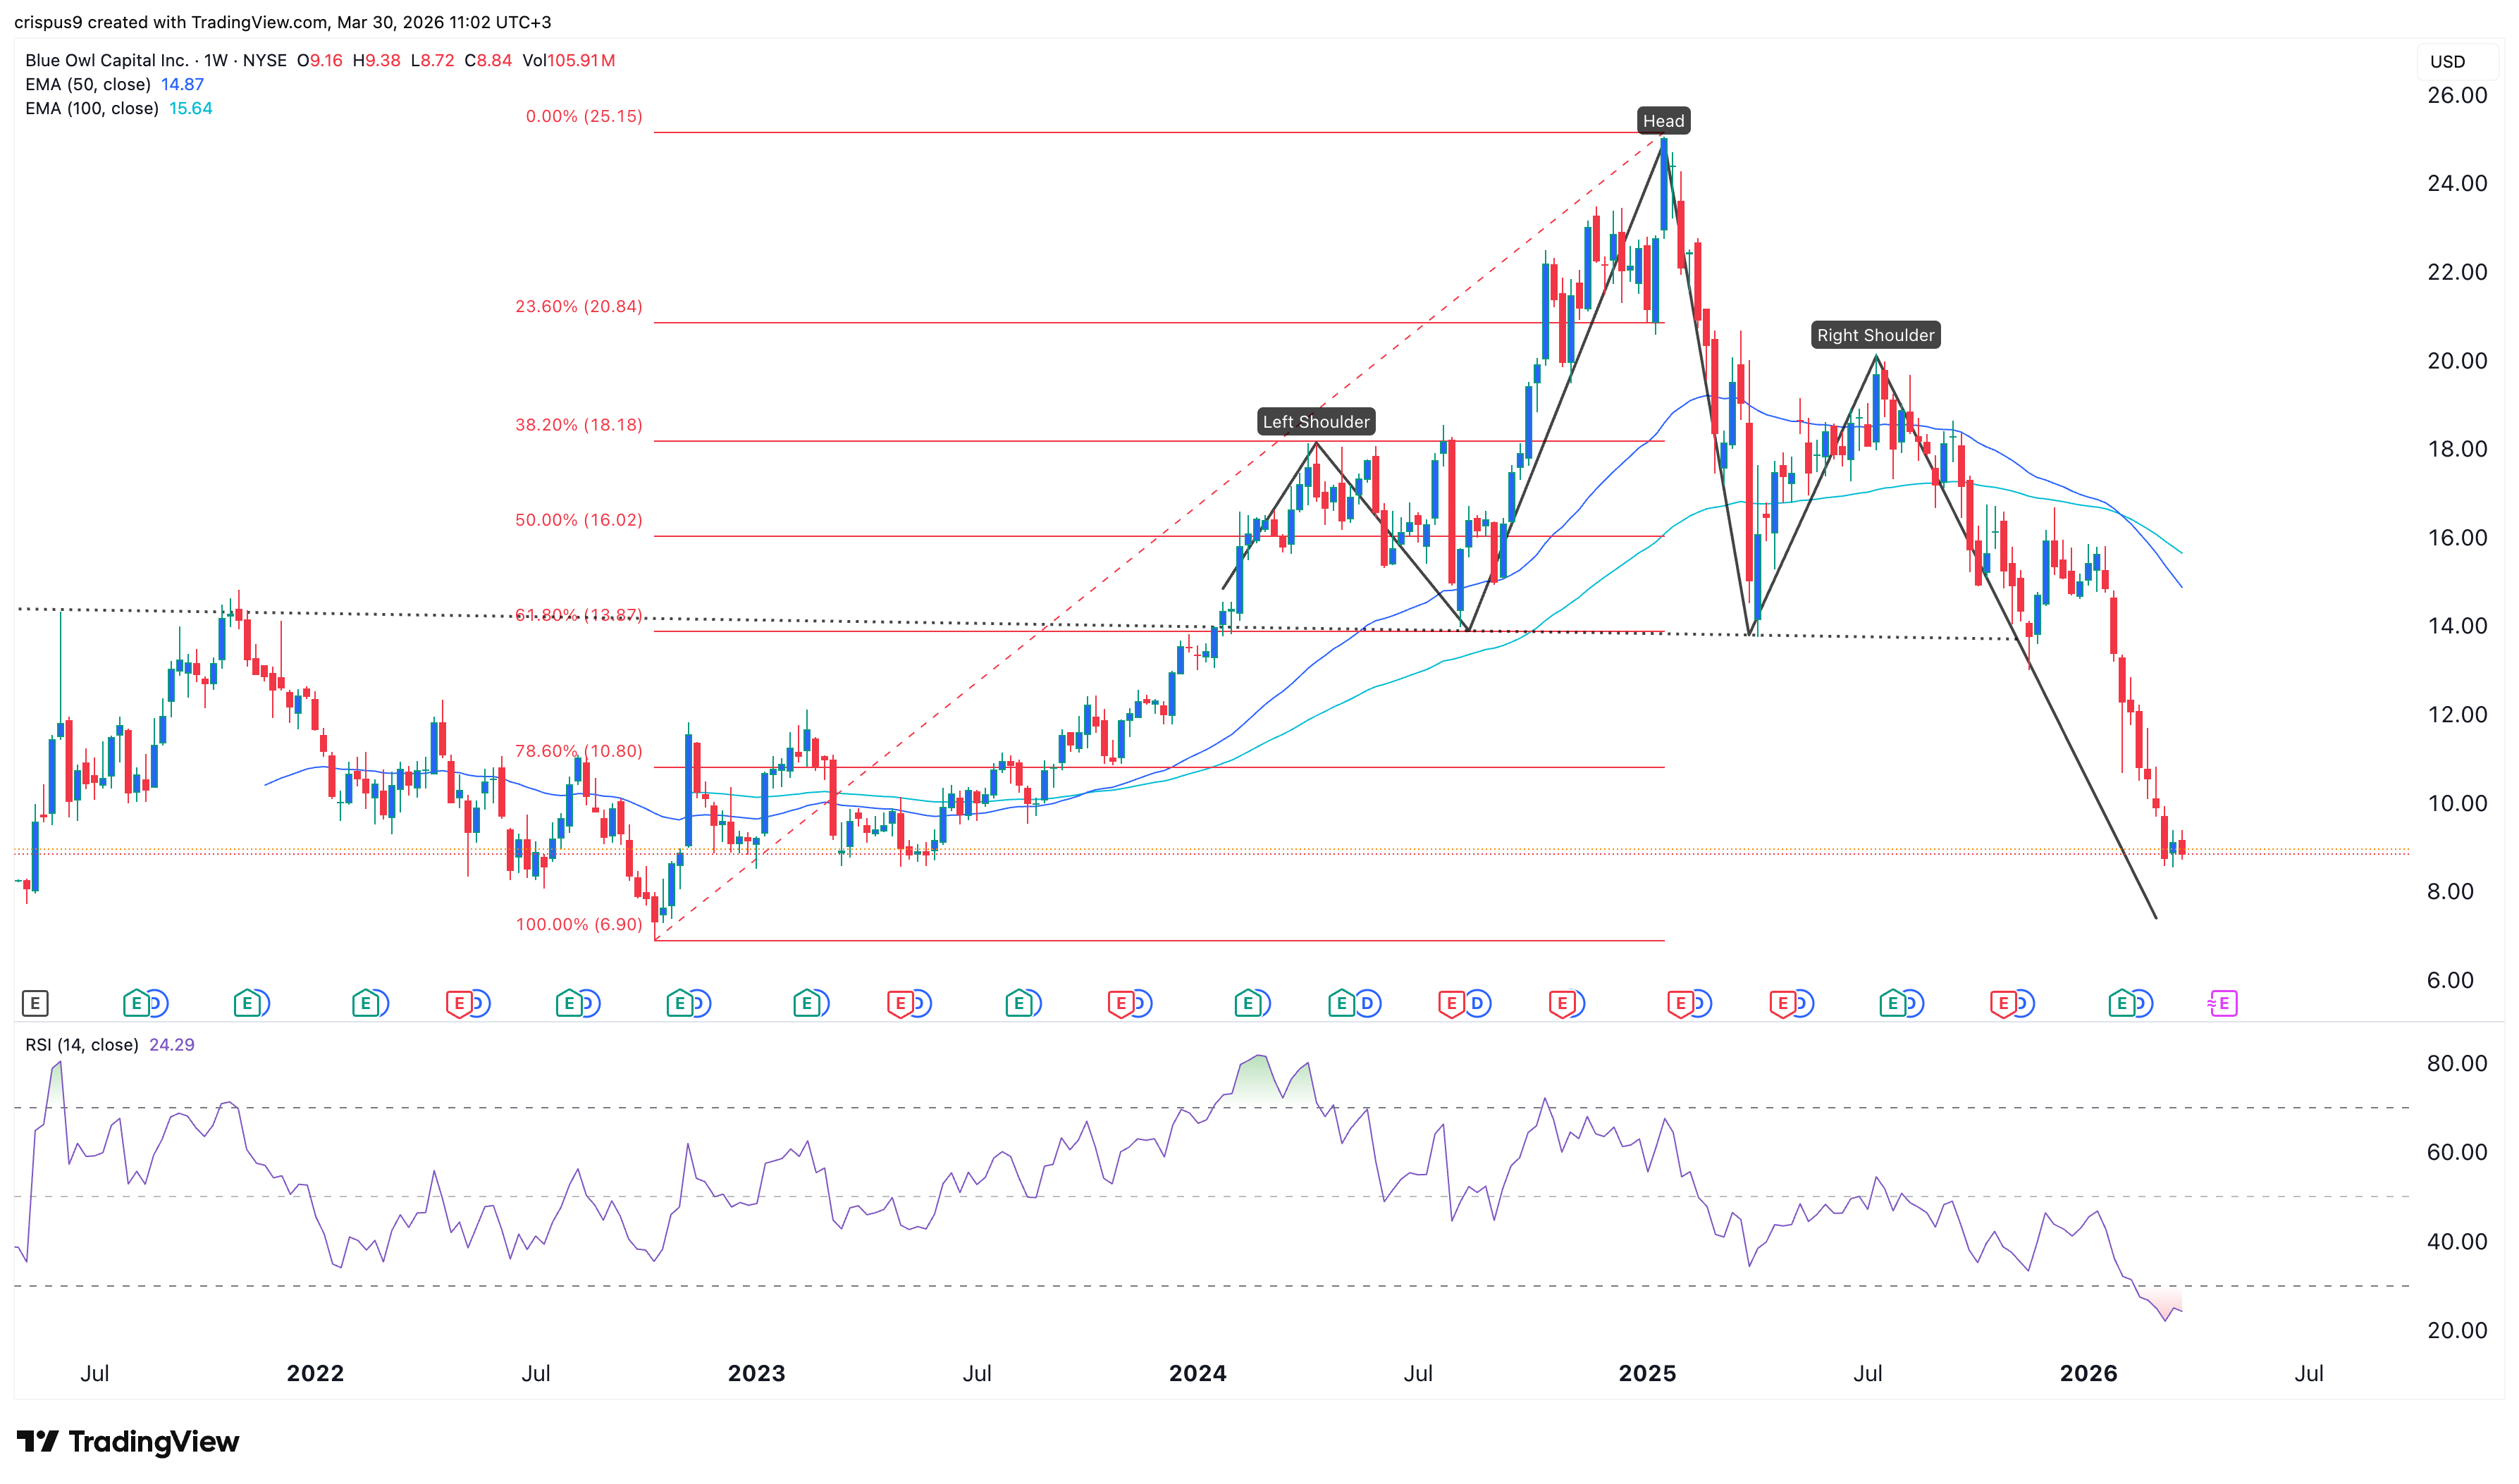
OWL stock chart | Source: TradingView
The weekly timeframe chart shows that the OWL stock price has plunged from a record high of $25 in January last year to the current $8.85.
It has formed a head-and-shoulders pattern, a common bearish reversal sign in technical analysis. It recently moved below the neckline at $13.82 in January. This neckline coincided with the 61.8% Fibonacci Retracement level.
The stock has remained below all moving averages, and has now formed a bearish flag pattern, a common bearish continuation sign in technical analysis. It dropped below the 78.6% Fibonacci Retracement level.
The Relative Strength Index (RSI) has dropped to the oversold level at 24 and is continuing to move downwards.
Therefore, the stock will likely continue falling, potentially to the key support level at $6.90, its lowest level in October 2022. In the long-term, however, the stock will likely bounce back as the fears wane.
The post As Blue Owl stock price implodes, is it safe to buy the dip? appeared first on Invezz


Read More

US Retail Stock Buying Slumps to Lowest Level Since Early 2020