Sell-side risk ratio hit 3-year high as Bitcoin broke above $73k

Share:
Predictions Markets
See what traders are focused on

The Bitcoin sell-side risk ratio is calculated by dividing the sum of all profits and losses realized on-chain by the realized capitalization, offering a comparative view of daily investor activity against the total market capitalization adjusted for real-time inflows and outflows.
A rise in this metric indicates a higher likelihood of sell-side pressure, potentially leading to increased market volatility.
Between Feb. 8 and March 13, the Bitcoin sell-side risk ratio saw a significant surge, climbing from 0.12% to 0.777%. This increase followed a significant rise in Bitcoin’s price from $45,330 to $73,104. This period marked the highest sell-side risk ratio and the first instance of the ratio surpassing the 0.75% threshold since March 9, 2021.
Following this peak, BTC dropped to $61,860 by Mar. 19 before recovering to $70,000 on Mar. 26. The sell-side risk ratio adjusted to 0.556%.
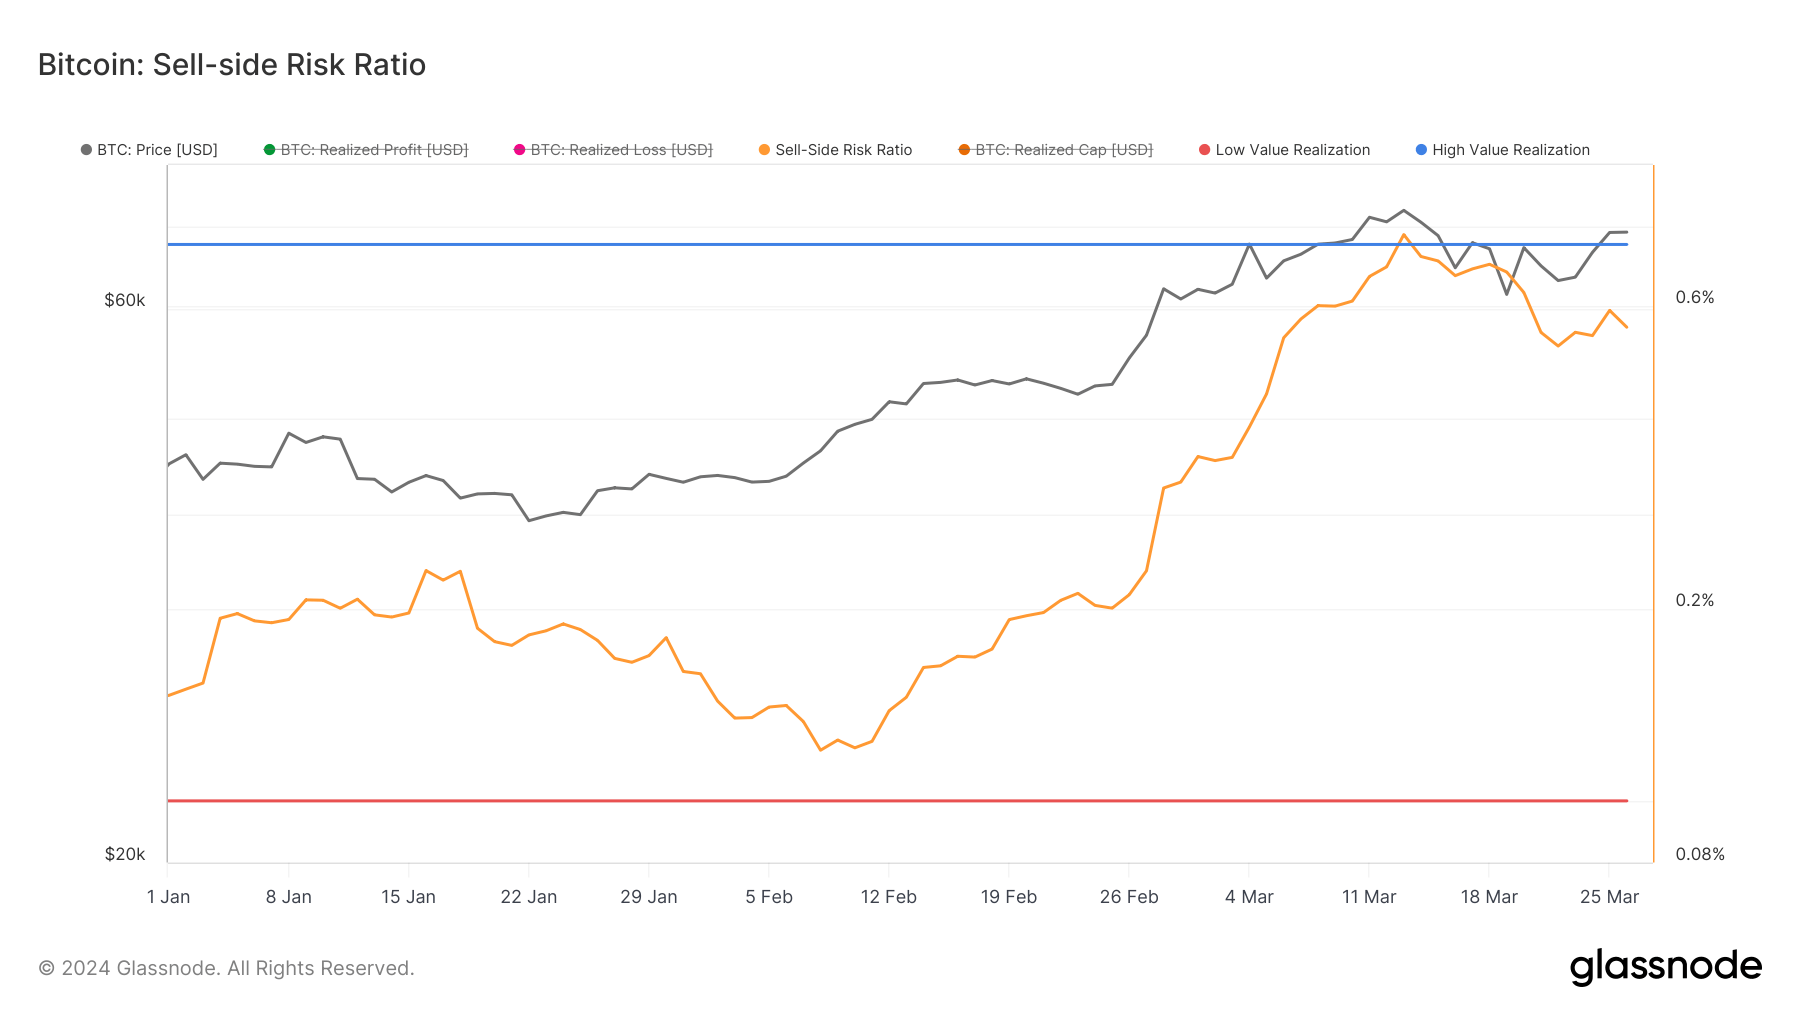
The increase of the sell-side risk ratio above its upper bound shows a period of high value realization among investors, often observed during the late stages of bull markets or bear market capitulation events. However, spikes like these can also occur at the beginning of bull cycles, particularly when the market undergoes initial corrections.
The subsequent correction in Bitcoin’s price and the sell-side risk ratio indicates volatility. However, this volatility is not without precedent. Since 2011, the trend has been toward diminishing returns with each market cycle, leading to lower highs in the sell-side risk ratio. This is consistent with the observed pattern where, with each cycle, investors are realizing less profit, hinting at a maturing market.
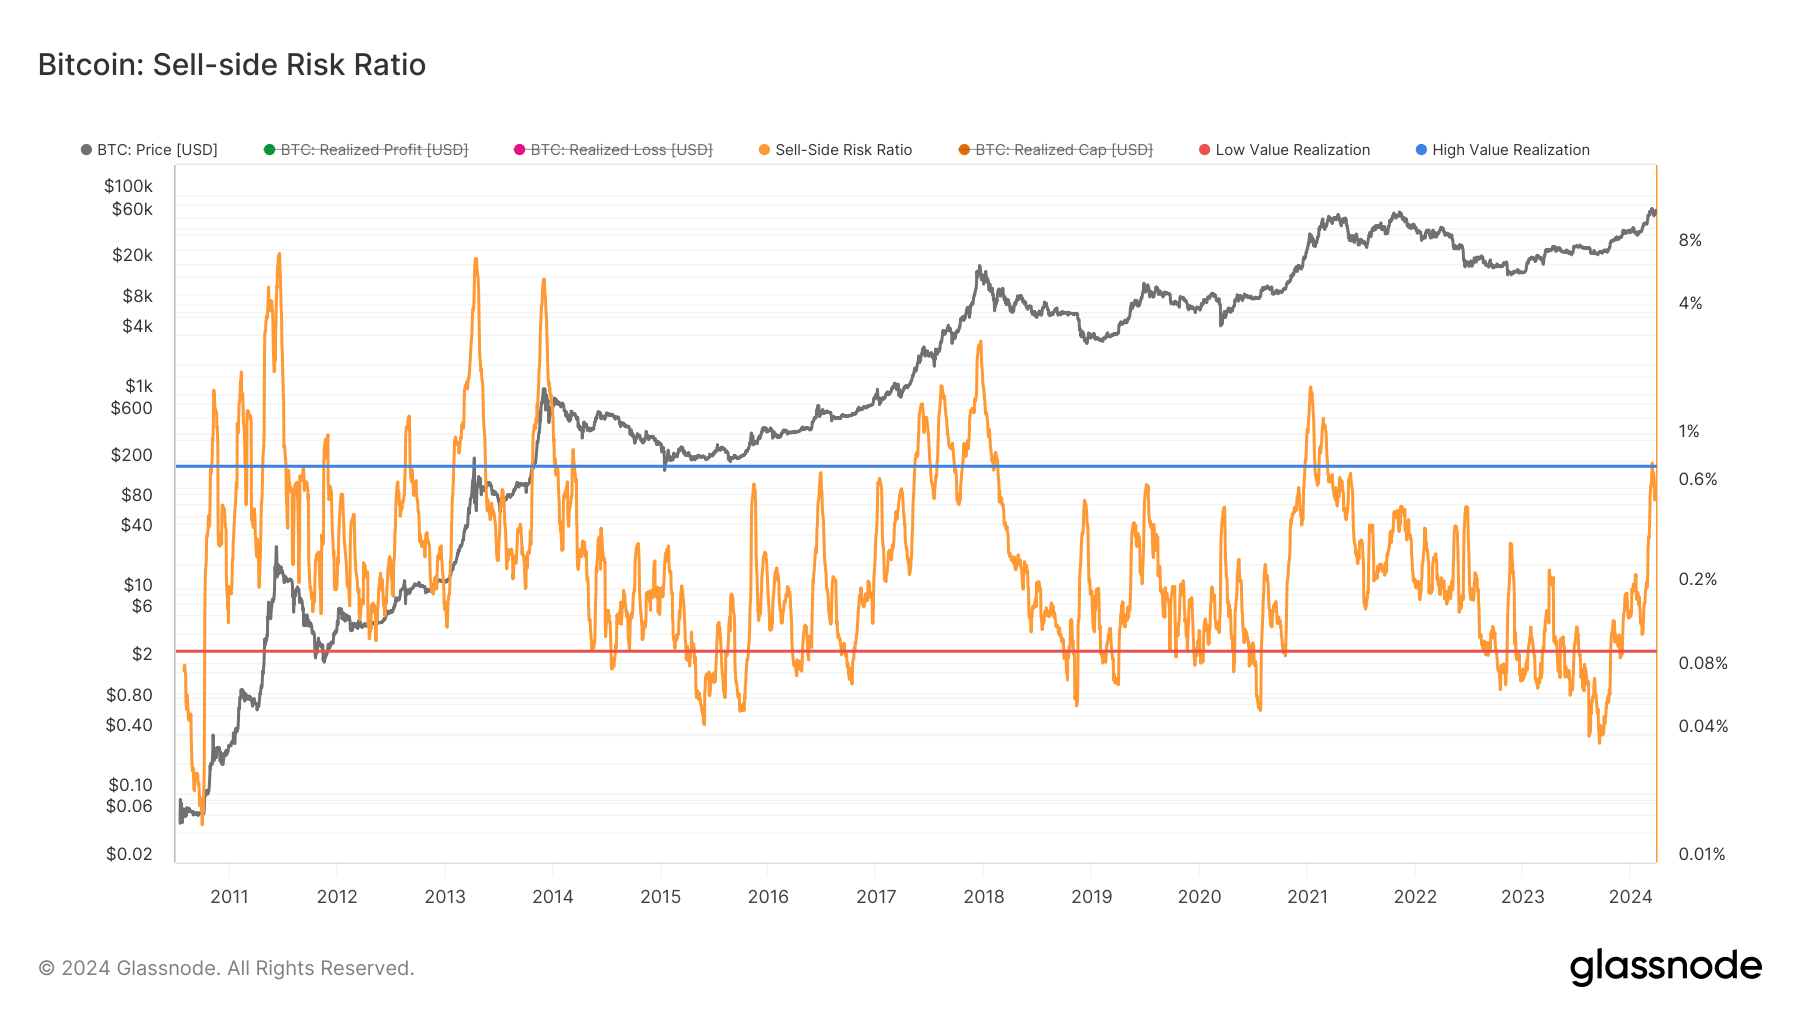
The continuous stay of the ratio above the 0.1% mark since Nov. 29, 2023, further emphasizes a shift from the very low value realization observed on Sept. 18, 2023, at 0.039%. This transition suggests a move away from market bottoms and accumulation phases towards more active and possibly speculative trading phases.
The break above the upper bound signals a significant turning point, likely driven by investor optimism and profit-taking. However, the historical trend towards lower highs in this ratio may indicate a gradual stabilization of the market, with less pronounced peaks in value realization as the market matures.
The post Sell-side risk ratio hit 3-year high as Bitcoin broke above $73k appeared first on CryptoSlate.


Read More
New Bitcoin study shows the strongest recurring liquidation warning signs cannot warn of an individual crash