PEPE Price Prediction: Triangle Breakout Could Send PEPE Coin Flying

PEPE’s Triangle Pattern Sparks Breakout Hopes
After a volatile week that saw $PEPE drop nearly 8%, traders are eyeing what could be a major technical setup forming on the charts. The memecoin’s price action now shows a triangle pattern — a classic sign of compression before a big move.
Meanwhile, Bitcoin’s pullback from its all-time high above $126K to below $123K has added pressure to the broader crypto market, leaving many wondering: will PEPE break out next?
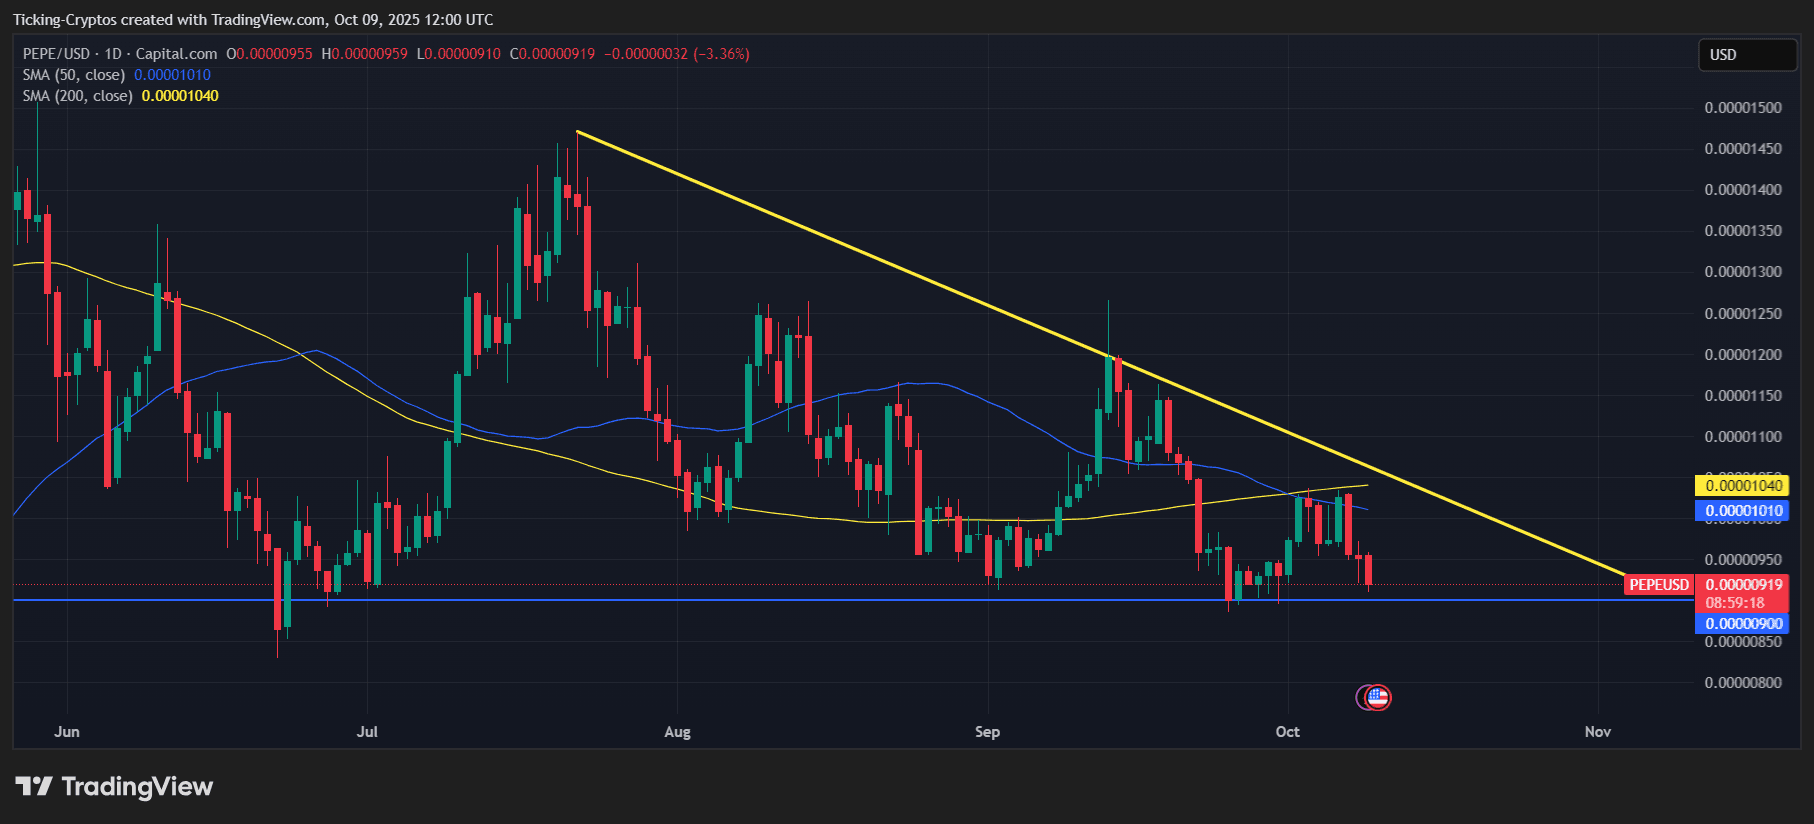
PEPE/USD 1-day chart - TradingView
PEPE Price Under Pressure — But Momentum Is Coiling
PEPE’s current structure shows a descending resistance line converging with a horizontal support zone around 0.00000900, forming a textbook triangle pattern. Here’s the technical breakdown:
- Current Trend: PEPE remains in consolidation, making lower highs under a descending trendline.
- Key Support: The 0.00000900 zone continues to hold, despite repeated tests this week.
- 50-day and 200-day SMAs: Sitting near 0.00001010 and 0.00001040, these levels act as critical resistance — a breakout above could signal the start of a bullish reversal.
- Volume: Decreasing volume often precedes volatility spikes — reinforcing the triangle’s “coiling spring” setup.
- Interpretation: The pattern suggests that PEPE is building energy for a significant move. A break above the upper trendline could ignite bullish momentum, while a drop below support may accelerate the decline.
Bitcoin’s Cooldown Is Setting the Stage
The recent Bitcoin retracement from $126K to below $123K reflects a healthy price adjustment after record highs. However, this short-term cooldown has spilled into the memecoin market.
Historically, PEPE’s volatility amplifies Bitcoin's direction — meaning once $BTC stabilizes, PEPE could move sharply in either direction.
If Bitcoin regains strength, traders expect PEPE to rally faster due to pent-up momentum and speculative appetite returning.
Key Levels to Watch for PEPE Coin
| Level | Type | Action Zone |
|---|---|---|
| 0.00000900 | Support | Main defense; a break below targets 0.00000860–0.00000850 |
| 0.00001010 | Resistance (50-DMA) | First bullish trigger if reclaimed |
| 0.00001040 | Resistance (200-DMA) | Momentum confirmation point |
| 0.00001150 | Breakout Target | Confirms triangle breakout |
| 0.00001220–0.00001300 | High Target Zone | Post-breakout upside zone |
PEPE Price Prediction: What Happens Next
Bullish Scenario — Breakout Imminent
If PEPE breaks above 0.00001010–0.00001040, the triangle breakout could send the memecoin flying.
- Short-term targets: 0.00001150 → 0.00001220 → 0.00001300
- Catalyst: Bitcoin recovery above $124K and renewed memecoin inflows
Neutral Scenario — More Coiling
PEPE may oscillate between 0.00000900 and 0.00001010, tightening further before the breakout.
This would extend the triangle’s apex into mid-October, increasing the likelihood of a volatile resolution once it snaps.
Bearish Scenario — Breakdown Risk
A daily close below 0.00000900 would invalidate the bullish triangle and point to further downside.
- Next supports: 0.00000860 → 0.00000800
- Catalyst: Bitcoin slipping below $122K or risk-off sentiment across altcoins.
Bottom Line
PEPE’s triangle formation signals a make-or-break moment. After an 8% dip this week and $Bitcoin brief correction, the stage is set for a major move.
If bulls reclaim key moving averages, $PEPE could break free from its consolidation and fly toward 0.000012–0.000013. But failure to hold the 0.000009 support risks another leg down.
The pattern is clear — PEPE’s next big move is just around the corner.
Read More
Don’t Be Like This Whale: Bet Heavily on These Altcoins, Lost Big

PEPE Price Prediction: Triangle Breakout Could Send PEPE Coin Flying
PEPE’s Triangle Pattern Sparks Breakout Hopes
After a volatile week that saw $PEPE drop nearly 8%, traders are eyeing what could be a major technical setup forming on the charts. The memecoin’s price action now shows a triangle pattern — a classic sign of compression before a big move.
Meanwhile, Bitcoin’s pullback from its all-time high above $126K to below $123K has added pressure to the broader crypto market, leaving many wondering: will PEPE break out next?
PEPE/USD 1-day chart - TradingView
PEPE Price Under Pressure — But Momentum Is Coiling
PEPE’s current structure shows a descending resistance line converging with a horizontal support zone around 0.00000900, forming a textbook triangle pattern. Here’s the technical breakdown:
- Current Trend: PEPE remains in consolidation, making lower highs under a descending trendline.
- Key Support: The 0.00000900 zone continues to hold, despite repeated tests this week.
- 50-day and 200-day SMAs: Sitting near 0.00001010 and 0.00001040, these levels act as critical resistance — a breakout above could signal the start of a bullish reversal.
- Volume: Decreasing volume often precedes volatility spikes — reinforcing the triangle’s “coiling spring” setup.
- Interpretation: The pattern suggests that PEPE is building energy for a significant move. A break above the upper trendline could ignite bullish momentum, while a drop below support may accelerate the decline.
Bitcoin’s Cooldown Is Setting the Stage
The recent Bitcoin retracement from $126K to below $123K reflects a healthy price adjustment after record highs. However, this short-term cooldown has spilled into the memecoin market.
Historically, PEPE’s volatility amplifies Bitcoin's direction — meaning once $BTC stabilizes, PEPE could move sharply in either direction.
If Bitcoin regains strength, traders expect PEPE to rally faster due to pent-up momentum and speculative appetite returning.
Key Levels to Watch for PEPE Coin
| Level | Type | Action Zone |
|---|---|---|
| 0.00000900 | Support | Main defense; a break below targets 0.00000860–0.00000850 |
| 0.00001010 | Resistance (50-DMA) | First bullish trigger if reclaimed |
| 0.00001040 | Resistance (200-DMA) | Momentum confirmation point |
| 0.00001150 | Breakout Target | Confirms triangle breakout |
| 0.00001220–0.00001300 | High Target Zone | Post-breakout upside zone |
PEPE Price Prediction: What Happens Next
Bullish Scenario — Breakout Imminent
If PEPE breaks above 0.00001010–0.00001040, the triangle breakout could send the memecoin flying.
- Short-term targets: 0.00001150 → 0.00001220 → 0.00001300
- Catalyst: Bitcoin recovery above $124K and renewed memecoin inflows
Neutral Scenario — More Coiling
PEPE may oscillate between 0.00000900 and 0.00001010, tightening further before the breakout.
This would extend the triangle’s apex into mid-October, increasing the likelihood of a volatile resolution once it snaps.
Bearish Scenario — Breakdown Risk
A daily close below 0.00000900 would invalidate the bullish triangle and point to further downside.
- Next supports: 0.00000860 → 0.00000800
- Catalyst: Bitcoin slipping below $122K or risk-off sentiment across altcoins.
Bottom Line
PEPE’s triangle formation signals a make-or-break moment. After an 8% dip this week and $Bitcoin brief correction, the stage is set for a major move.
If bulls reclaim key moving averages, $PEPE could break free from its consolidation and fly toward 0.000012–0.000013. But failure to hold the 0.000009 support risks another leg down.
The pattern is clear — PEPE’s next big move is just around the corner.
Read More