


Ethereum Price Analysis: Pullback Chances Rise as Bullish Momentum Fades
Ethereum remains capped beneath the critical 200-day moving average at $2.6K, signaling ongoing distribution among market participants.
Given the current price structure, a bearish correction appears increasingly likely in the near term.
Technical Analysis
By ShayanMarkets
The Daily Chart
Ethereum continues to face firm resistance at the 200-day moving average, currently hovering near the $2.6K level. This barrier has so far remained unbroken, signaling persistent bearish sentiment and a lack of follow-through from the bulls. The ongoing failure to reclaim this level suggests the formation of a distribution phase, often indicative of increased sell-side pressure.
Moreover, the appearance of a bearish divergence between price and the RSI indicator adds weight to the case for a potential pullback. With momentum fading, a gradual decline toward the $2.2K support region is becoming a likely short- to mid-term scenario.
However, should ETH unexpectedly break above the 200-day MA, it may trigger a short squeeze, propelling the price sharply higher due to the liquidity resting above the current resistance.
The 4-Hour Chart
Zooming into the 4-hour timeframe, Ethereum remains confined within a rising wedge pattern, typically viewed as a bearish reversal formation. After bouncing off the wedge’s lower boundary near $2.5K, the price has made another attempt at testing resistance around $2.6K, but upward momentum appears to be lacking.
The current structure suggests further range-bound movement inside the wedge until a decisive breakout occurs. Given the bearish setup, a downward break from the pattern seems more probable, potentially targeting the $2.2K support zone. Still, traders should be mindful of the liquidity cluster above $2.7K, which could attract smart money activity and initiate a liquidation-driven rally before any correction materializes.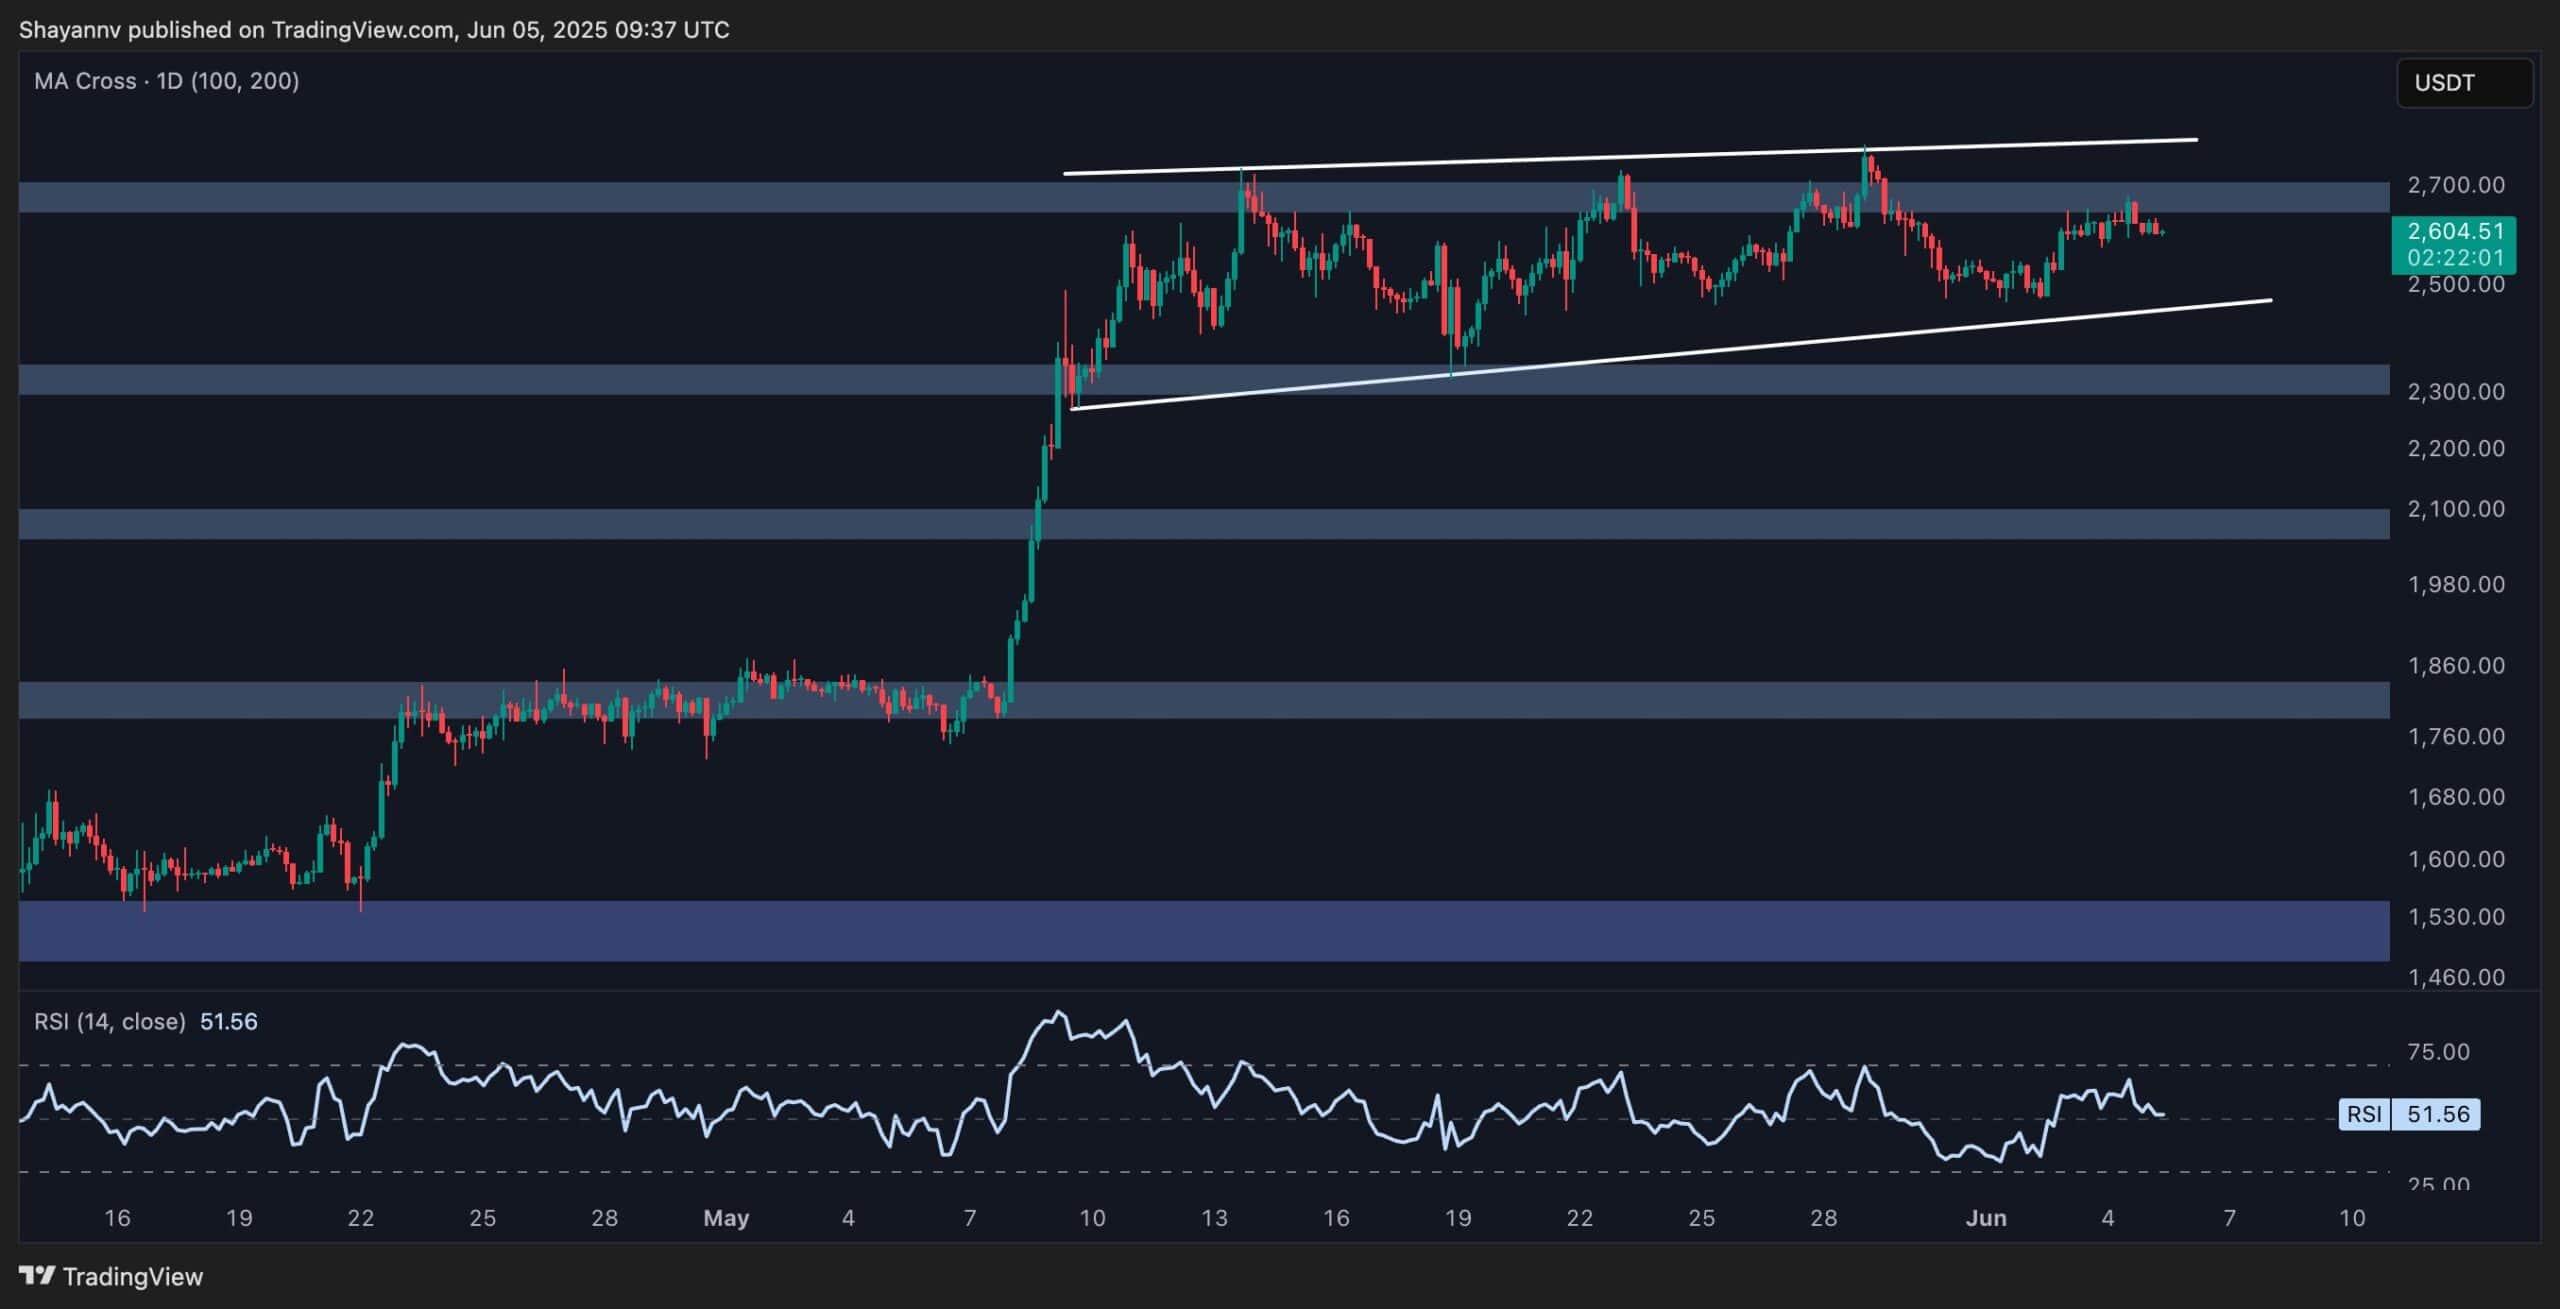
Onchain Analysis
By ShayanMarkets
Ethereum is currently consolidating within a wedge pattern, reflecting a phase of indecision in the market. The Binance Liquidation Heatmap highlights key liquidity zones that may influence price direction. Notably, significant liquidity clusters are positioned near the $2.5K and $2.7K levels, just below and above the wedge.
These areas are prime targets for smart money to trigger liquidations and exploit retail positioning. As such, a breakout in either direction could prompt a sharp move fueled by a liquidation cascade. Given the elevated potential for volatility, disciplined risk management will be crucial in the days ahead.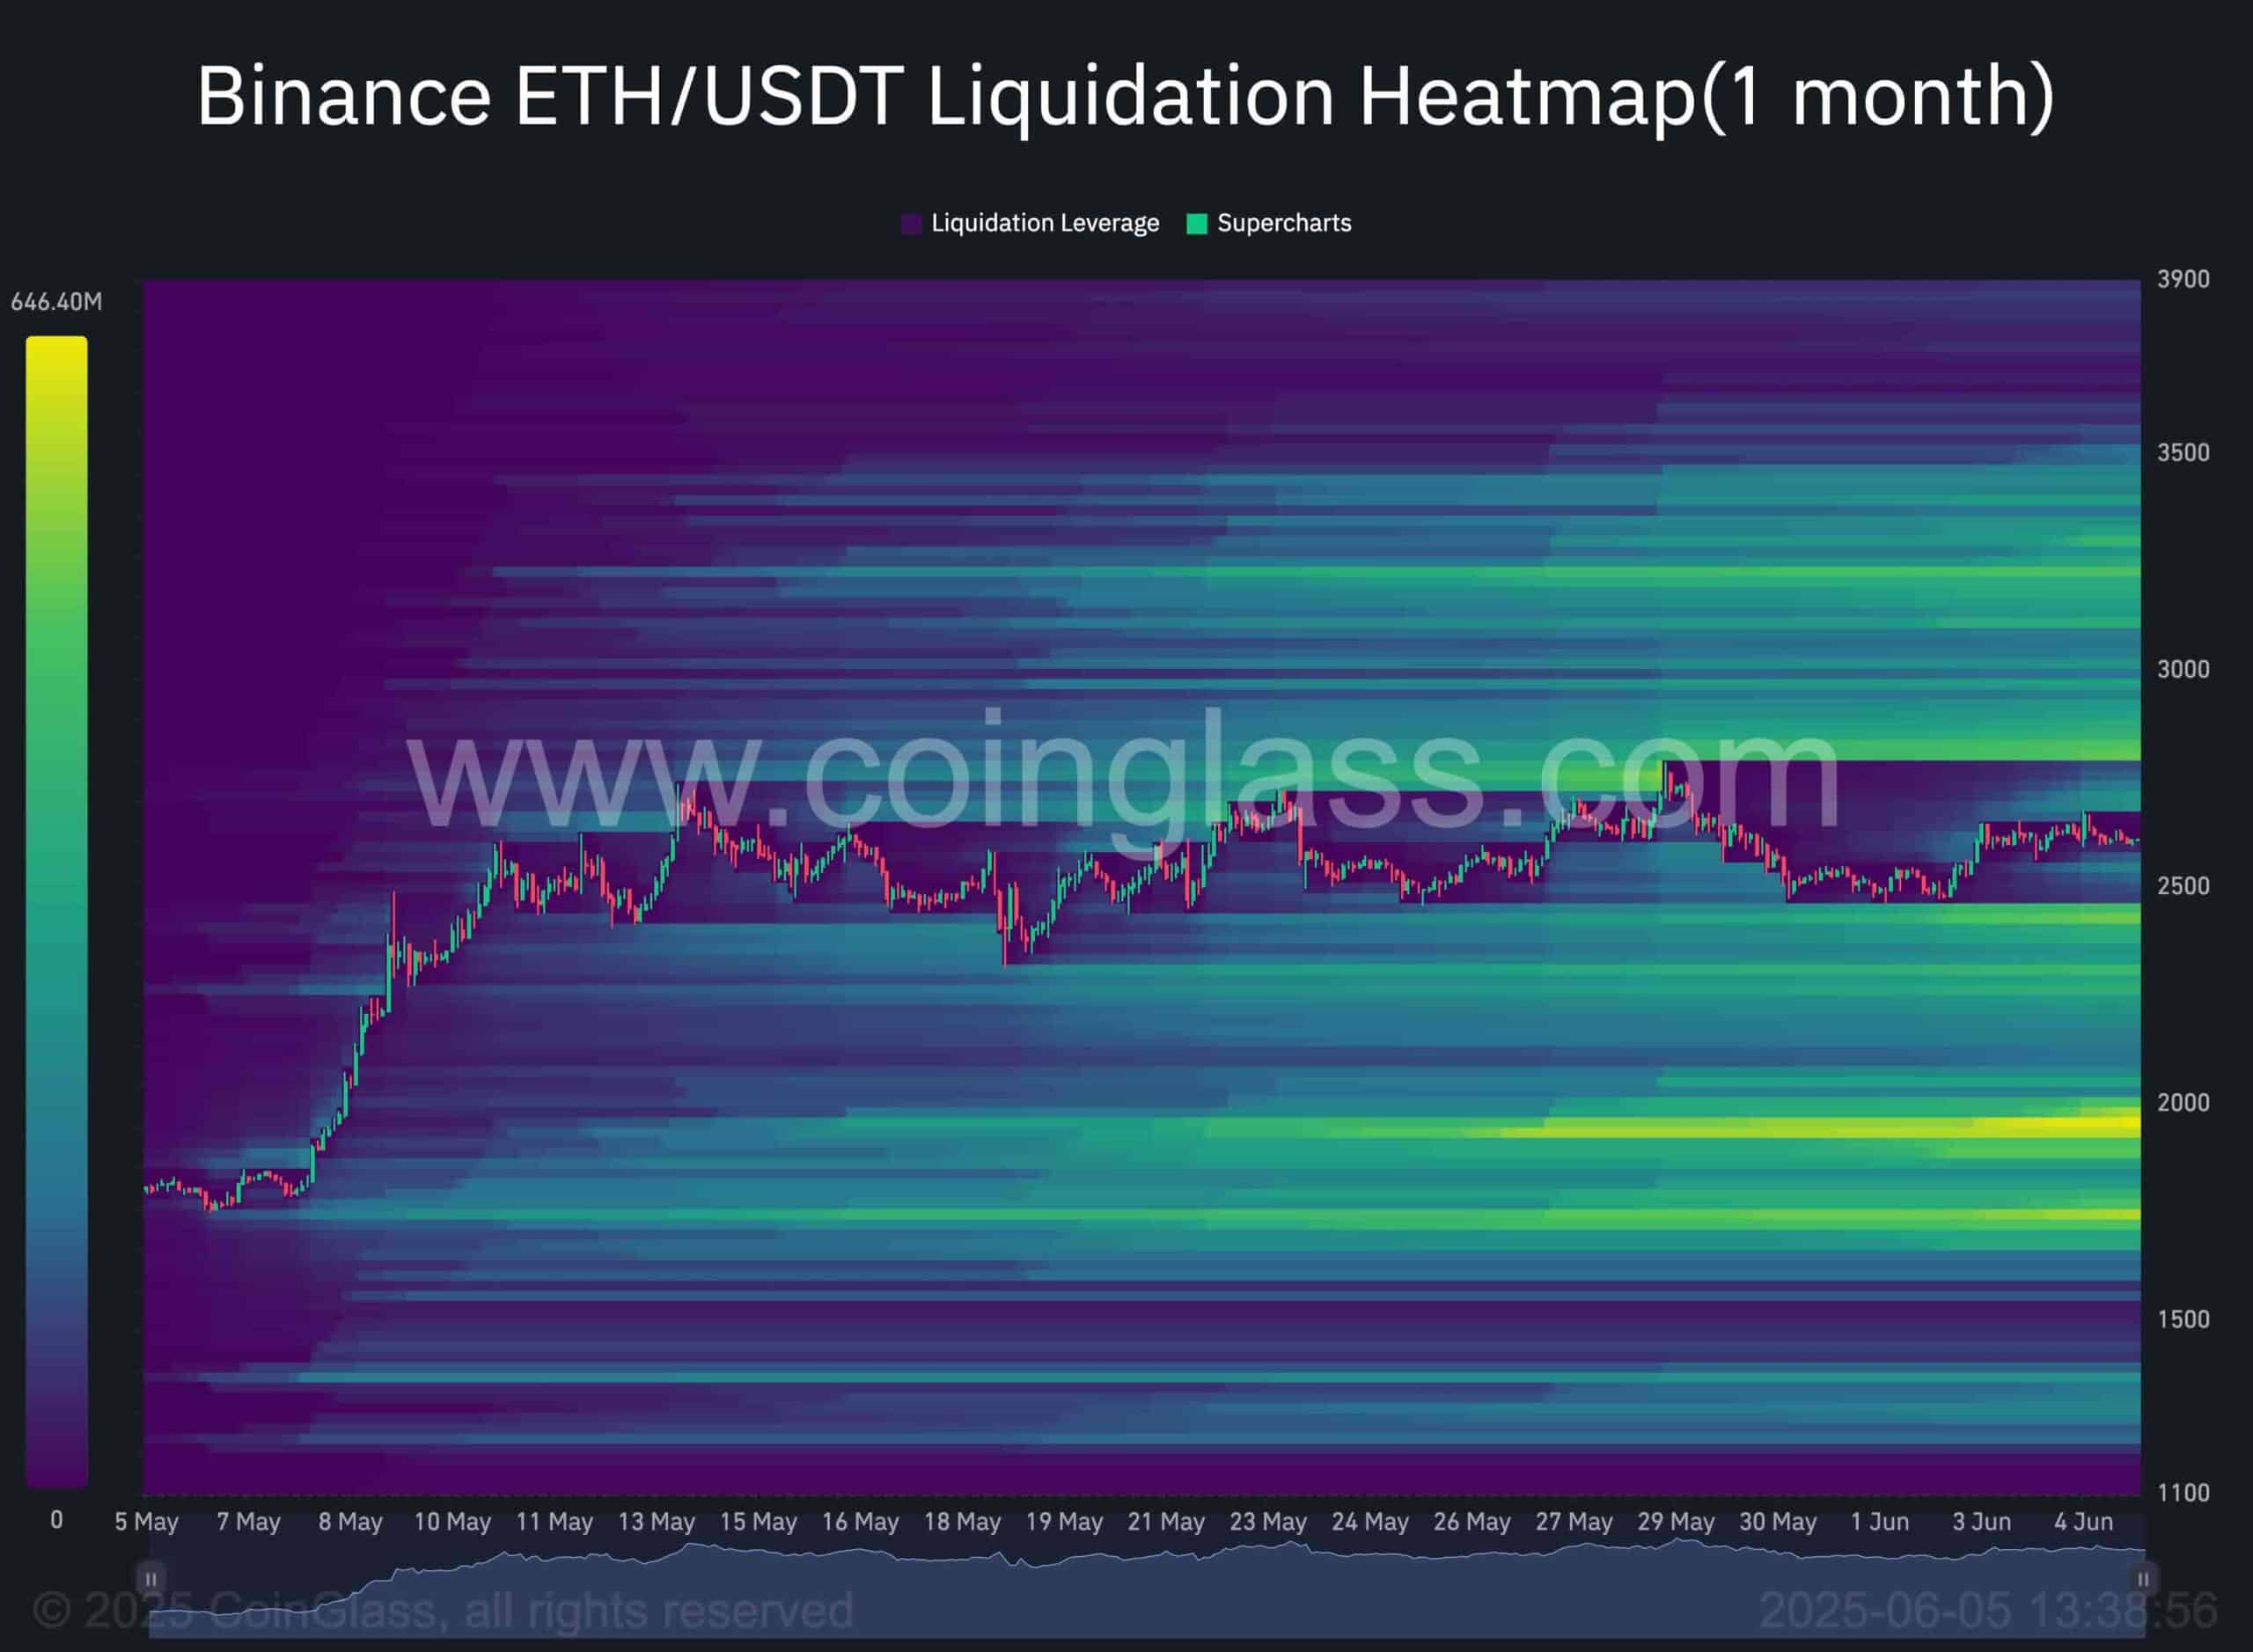
The post Ethereum Price Analysis: Pullback Chances Rise as Bullish Momentum Fades appeared first on CryptoPotato.
Read More