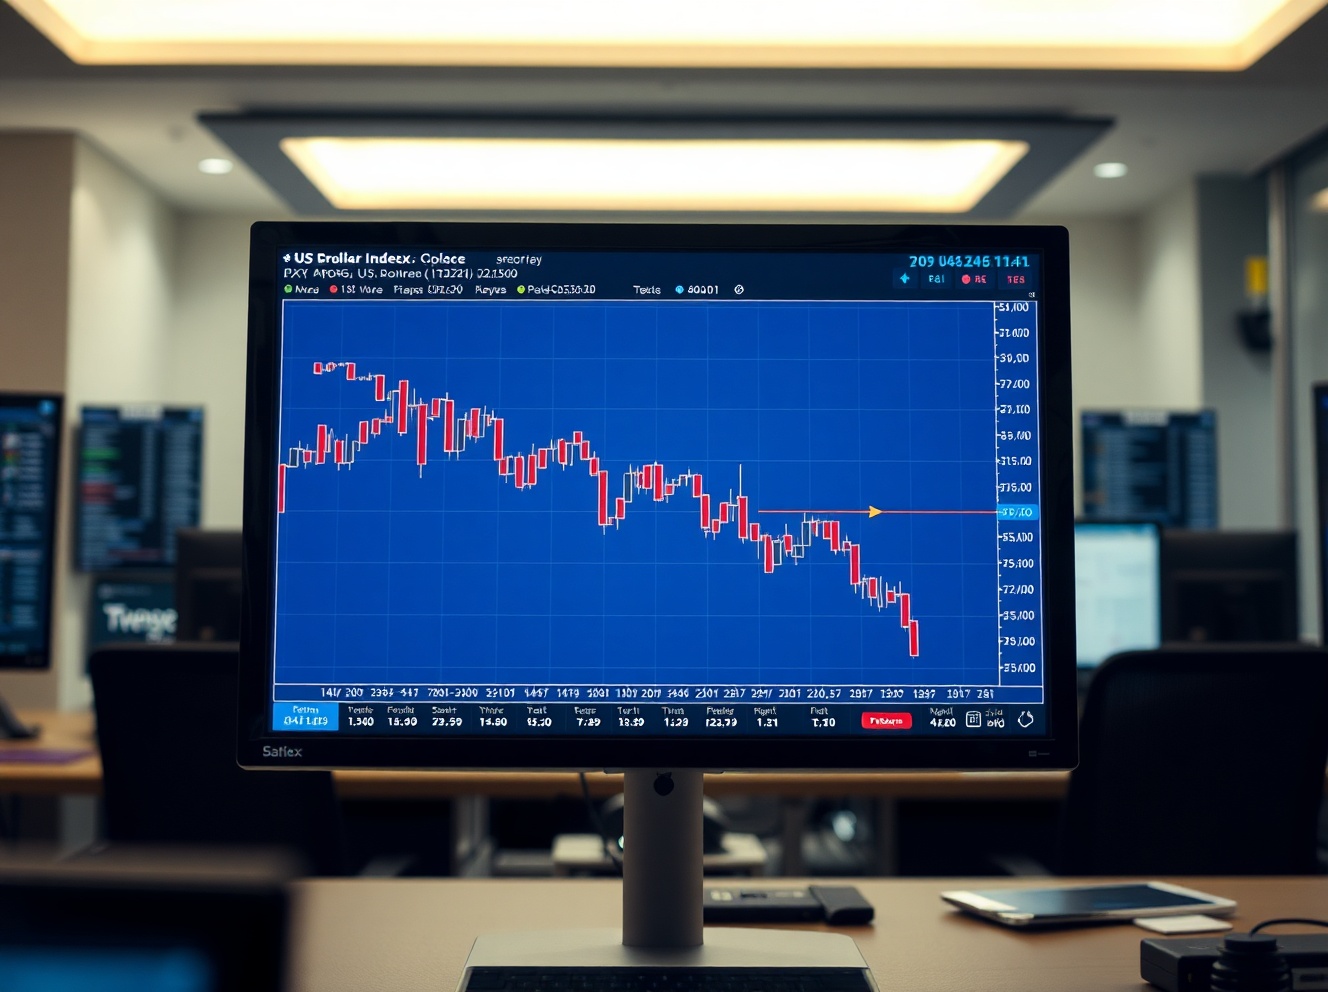
US Dollar Index Price Forecast: Break Above 100.00 Would Confirm Double Bottom
Share:
The US Dollar Index is at a technical inflection point with two lows near 99.20 and a neckline at 100.00; a decisive daily close above 100.00 would confirm a double bottom and target around 101.50 while a drop below 99.00 would invalidate the pattern. A stronger dollar driven by Fed policy shifts and risk-off flows would likely pressure crypto and DeFi risk assets, weighing on DEX/CEX volumes, token launches, funding and broader adoption.
Predictions Markets
See what traders are focused on

BitcoinWorld
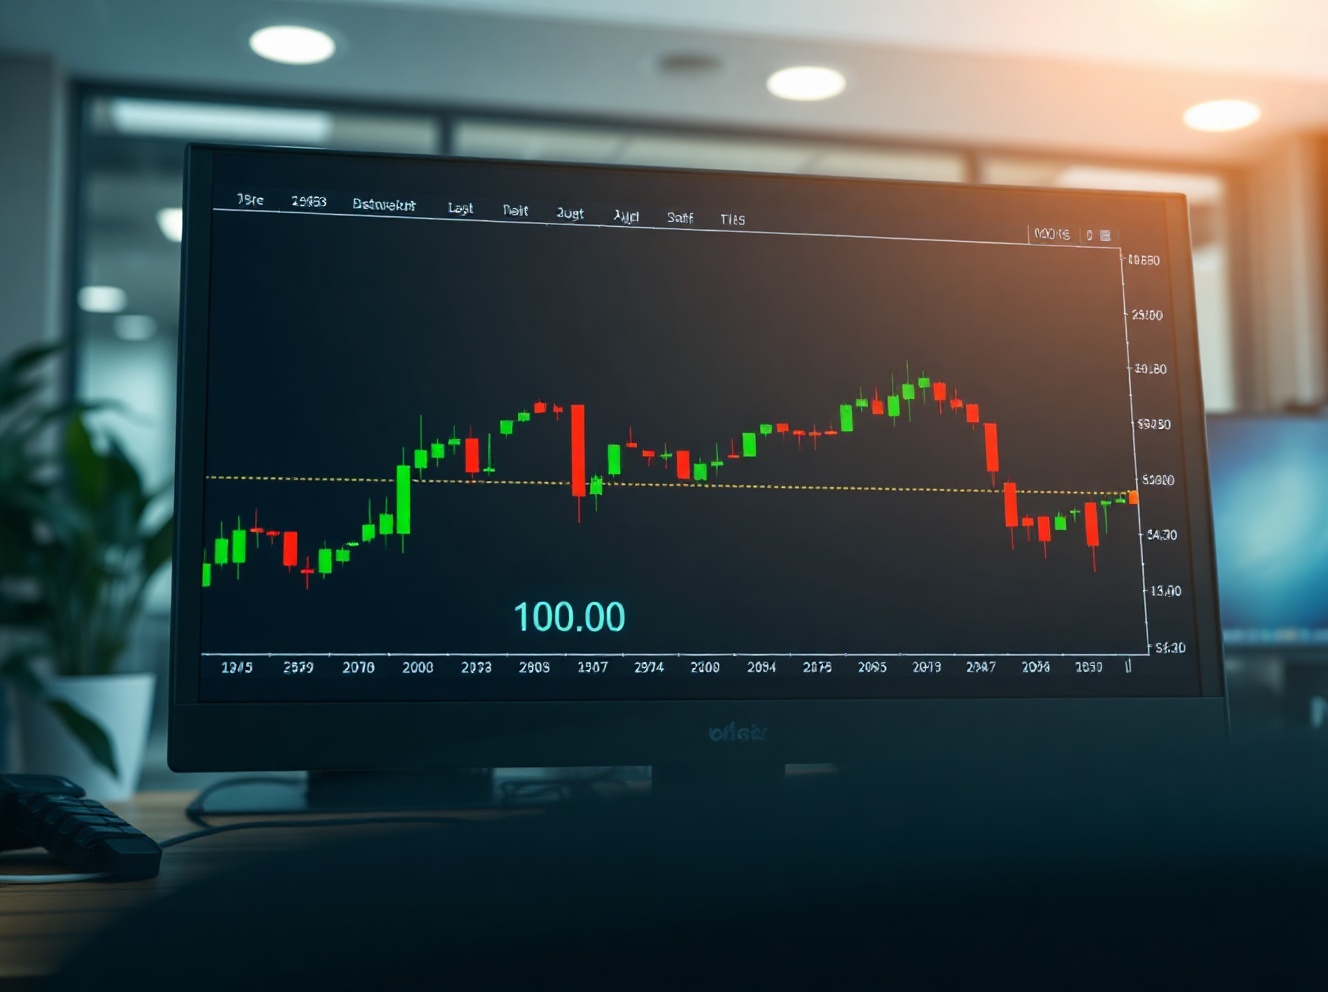
US Dollar Index Price Forecast: Break Above 100.00 Would Confirm Double Bottom
The US Dollar Index (DXY) is approaching a critical technical juncture: a sustained break above the 100.00 level would confirm a double bottom pattern, potentially signaling a shift in the dollar’s near-term trajectory.
Understanding the Double Bottom Pattern
A double bottom is a bullish reversal pattern that forms after a downtrend, characterized by two distinct lows at roughly the same price level, separated by a moderate peak. The pattern is confirmed when price breaks above the peak (the neckline) on increased volume. In the case of the DXY, the neckline sits at 100.00, a level that has acted as both support and resistance in recent months.
As of this analysis, the DXY has formed two lows near 99.20, with the interim high at 100.00. A decisive daily close above 100.00 would trigger the pattern, with a measured move target calculated by adding the height of the pattern to the breakout level, suggesting a potential advance toward 101.50 or higher.
Market Context and Implications
The dollar’s movement is closely tied to Federal Reserve policy expectations, global risk sentiment, and relative interest rate differentials. A confirmed double bottom would likely reflect growing confidence in the US economy or a shift in rate cut expectations, potentially impacting global markets.
Traders and investors watch the DXY closely because a stronger dollar can pressure commodities, emerging market currencies, and multinational corporate earnings. Conversely, a weaker dollar tends to support gold and other dollar-denominated assets.
Key Levels to Watch
- Immediate resistance: 100.00 (neckline)
- Support: 99.20 (pattern lows)
- Upside target if breakout: 101.50 (measured move)
- Invalidation: A drop below 99.00 would negate the pattern
Why This Matters for Forex and Global Markets
For forex traders, the DXY serves as a barometer for the greenback’s overall strength. A breakout above 100.00 could trigger momentum buying, affecting major pairs like EUR/USD, GBP/USD, and USD/JPY. It also influences investment flows into US assets and can impact global debt markets.
Moreover, the dollar’s direction often correlates with risk appetite. A stronger dollar may signal a flight to safety, while a weaker dollar typically accompanies risk-on sentiment. Understanding the technical setup helps market participants anticipate potential moves and adjust their strategies accordingly.
Conclusion
The US Dollar Index is at a pivotal point. A break above 100.00 would confirm a double bottom, opening the door for further upside. However, until that level is decisively cleared, the pattern remains unconfirmed, and traders should watch for volume and follow-through buying to validate the signal.
FAQs
Q1: What is a double bottom pattern in forex trading?
A double bottom is a bullish reversal chart pattern that forms after a downtrend, indicating a potential shift from selling to buying pressure. It is confirmed when price breaks above the neckline resistance level.
Q2: Why is the 100.00 level important for the US Dollar Index?
The 100.00 level has historically served as a psychological and technical barrier. A break above it would confirm the double bottom pattern and could trigger further upside momentum.
Q3: What could invalidate the double bottom pattern?
A drop below the pattern’s lows (around 99.20) would invalidate the setup, suggesting the downtrend may resume. Traders often place stop-loss orders below this level to manage risk.
This post US Dollar Index Price Forecast: Break Above 100.00 Would Confirm Double Bottom first appeared on BitcoinWorld.
In This News
Coins

$ 1.35
-0.01%Predictions Markets
See what traders are focused on
Share:
In This News
Coins
$ 1.35
-0.01%Predictions Markets
See what traders are focused on
Share:
Read More

USD Index Under Pressure: Key Support Zone Tested as Dollar Weakness Persists