


Here’s How Low XRP Can Go if $0.6 Fails (Ripple Price Analysis)
Ripple’s price has been trending lower against both the USDT and BTC. Yet, market participants can still be optimistic as significant support levels are available.
Technical Analysis
By TradingRage
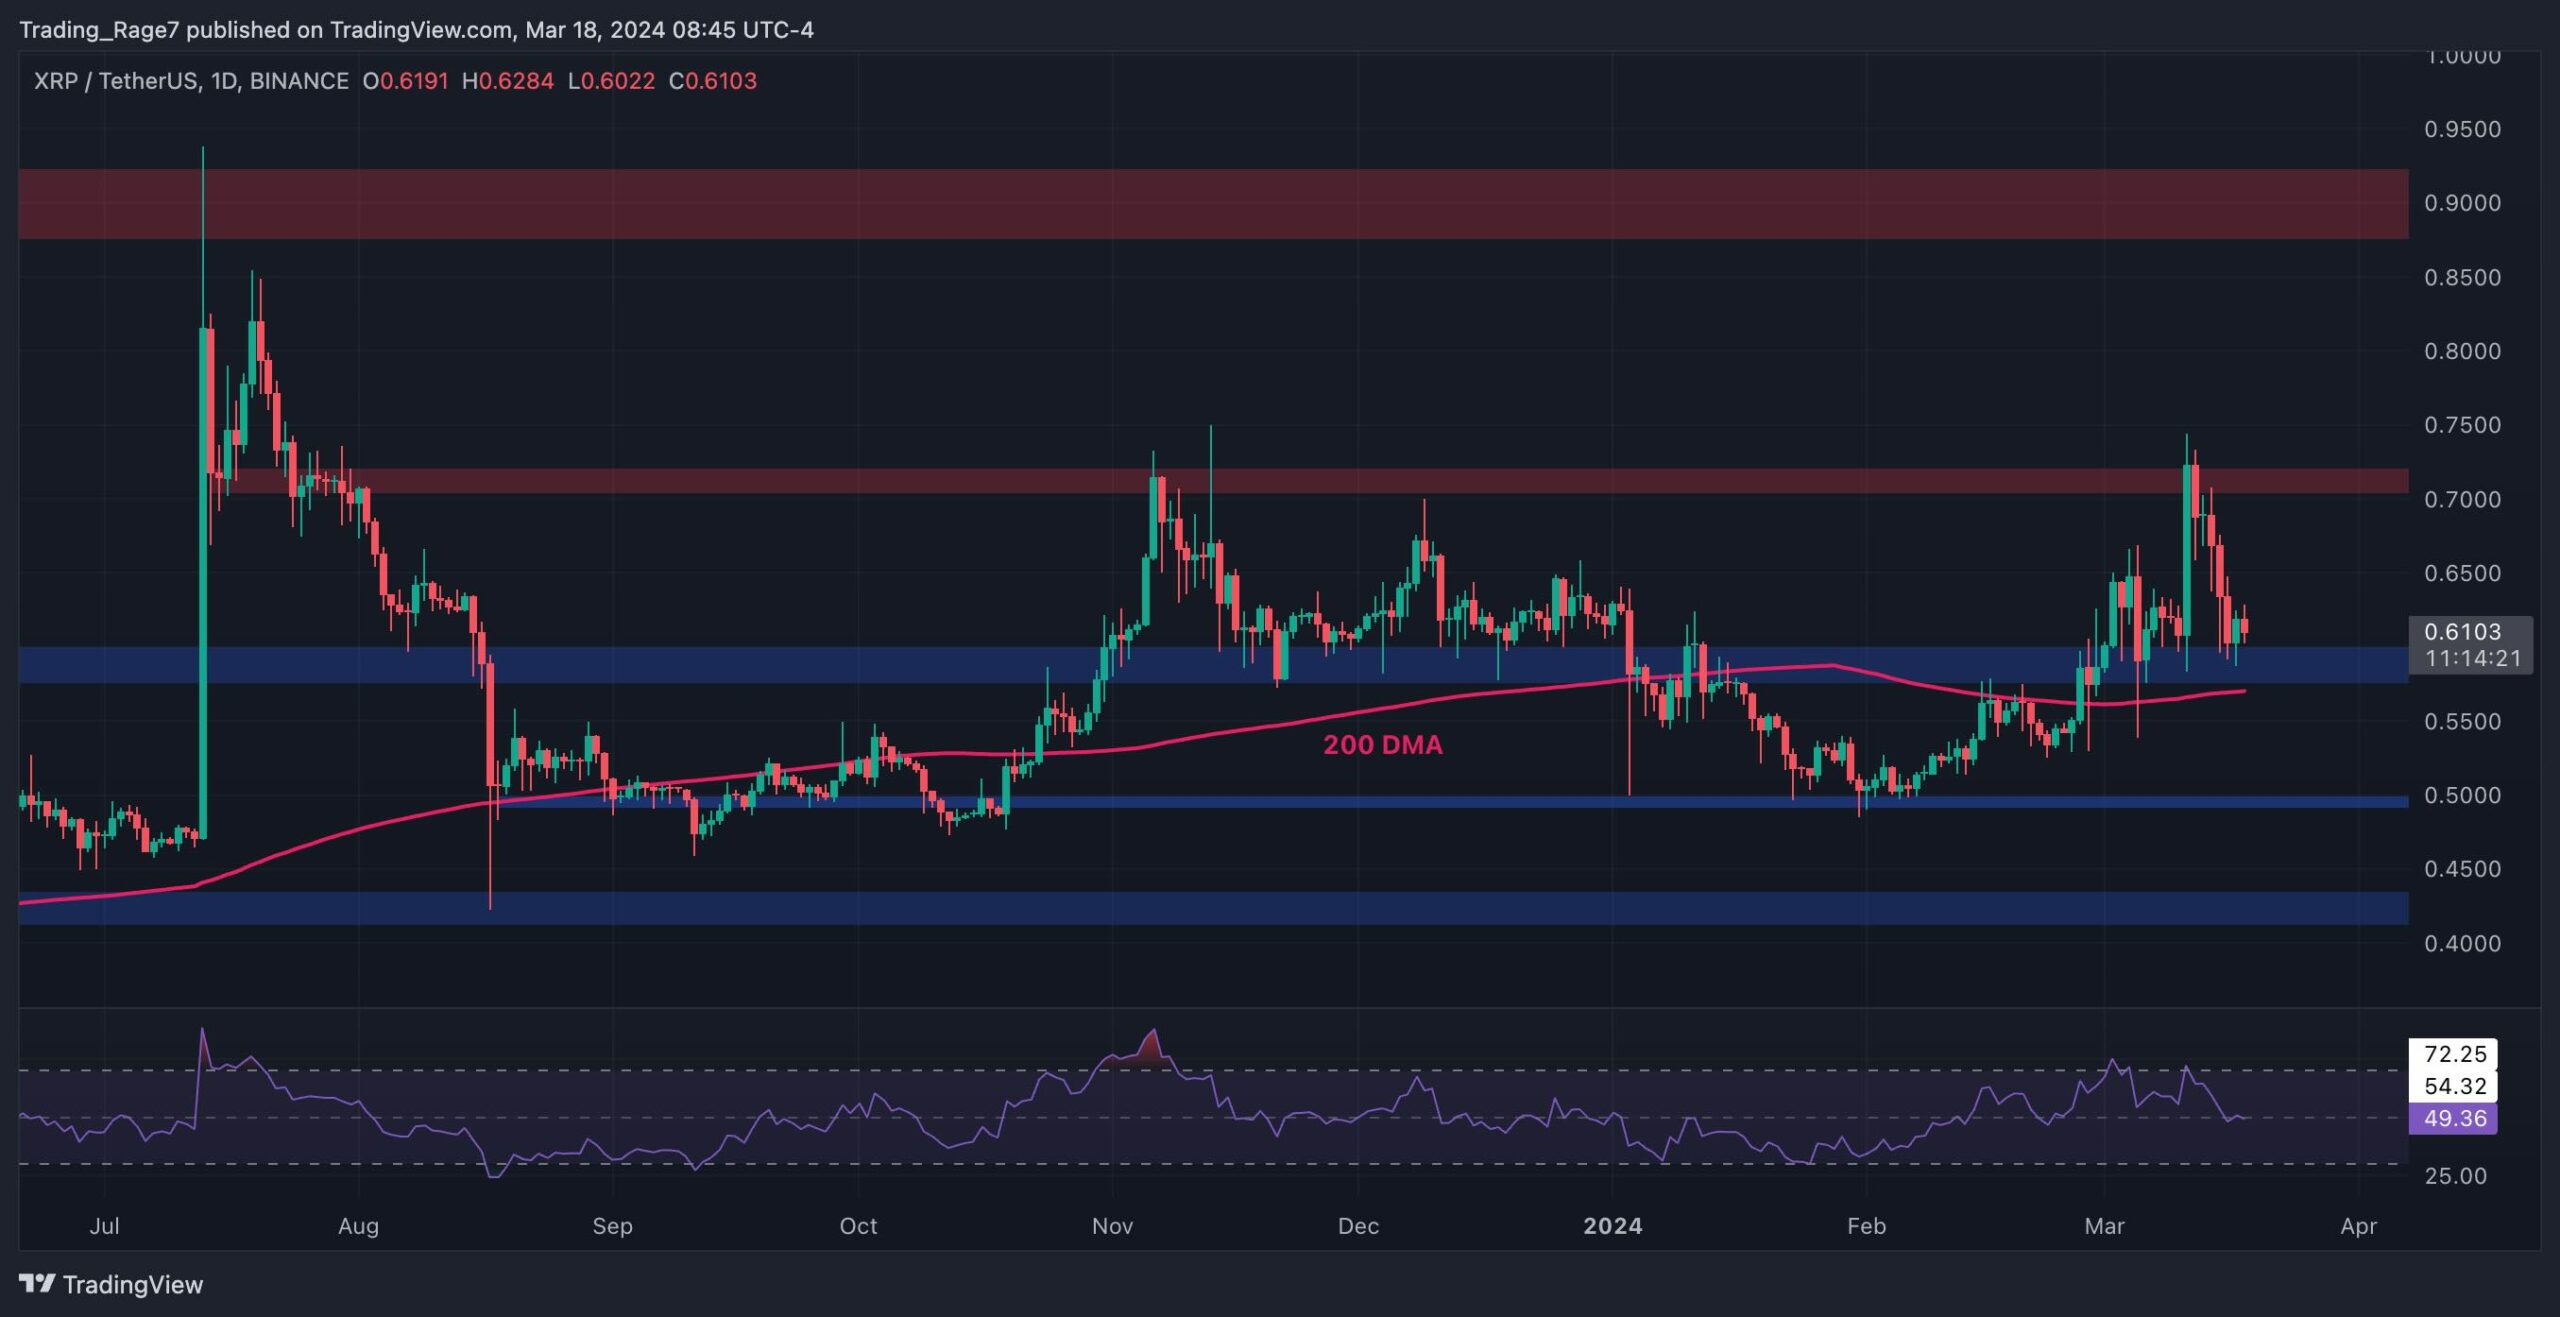
The USDT Paired Chart
Against USDT, the price has been dropping consistently since its rejection from $0.7. Yet, the $0.6 support level is preventing a further decline.
Nevertheless, in case of a breakdown, the 200-day moving average located around the $0.57 mark can still act as a potential turning point for XRP.
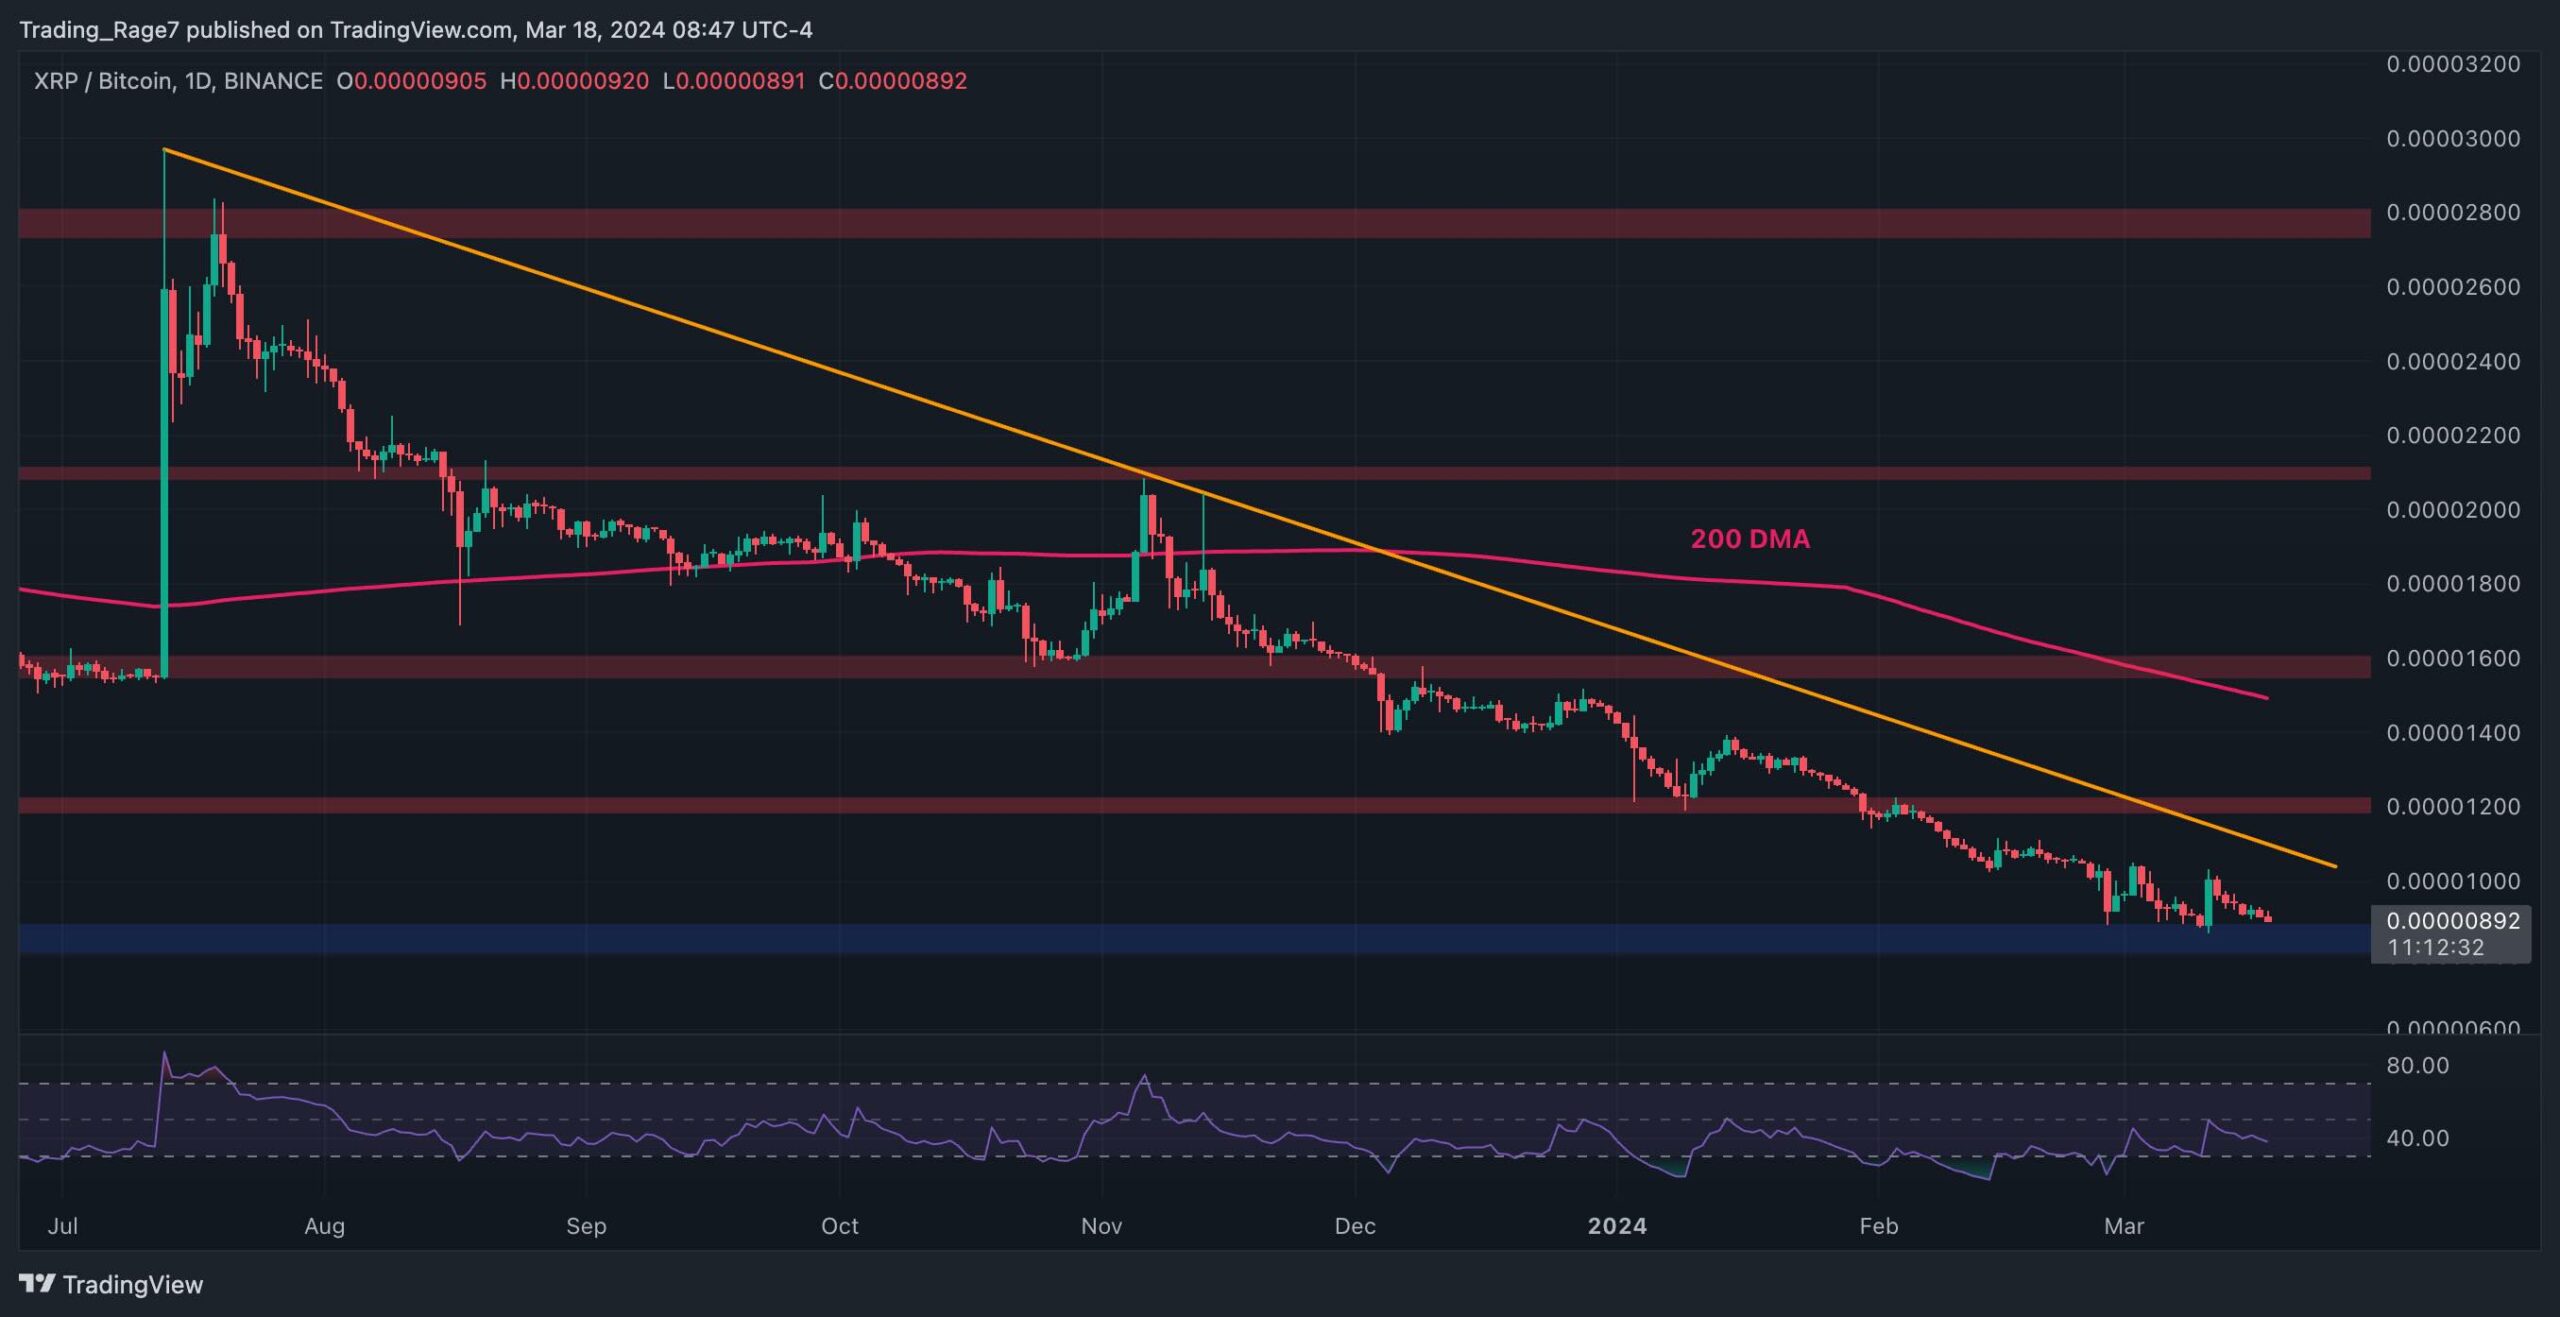
The BTC Paired Chart
Looking at the chart against Bitcoin, the market has been trending lower for a long time. The XRP price is currently testing the 900 SAT support zone once again.
If XRP bounces off this level once again, it will likely attack the long-term bearish trendline. If the price breaks it to the upside, the 1200 SAT resistance level can be the next target. On the other hand, a break below the 900 SAT support zone can be disastrous, as it can lead to a significant crash.
The post Here’s How Low XRP Can Go if $0.6 Fails (Ripple Price Analysis) appeared first on CryptoPotato.
Read More

Can XRP Market Cap Touch $1.5 Trillion? Analyst Reveals The Math Behind It

Here’s How Low XRP Can Go if $0.6 Fails (Ripple Price Analysis)
Ripple’s price has been trending lower against both the USDT and BTC. Yet, market participants can still be optimistic as significant support levels are available.
Technical Analysis
By TradingRage
The USDT Paired Chart
Against USDT, the price has been dropping consistently since its rejection from $0.7. Yet, the $0.6 support level is preventing a further decline.
Nevertheless, in case of a breakdown, the 200-day moving average located around the $0.57 mark can still act as a potential turning point for XRP.
The BTC Paired Chart
Looking at the chart against Bitcoin, the market has been trending lower for a long time. The XRP price is currently testing the 900 SAT support zone once again.
If XRP bounces off this level once again, it will likely attack the long-term bearish trendline. If the price breaks it to the upside, the 1200 SAT resistance level can be the next target. On the other hand, a break below the 900 SAT support zone can be disastrous, as it can lead to a significant crash.
The post Here’s How Low XRP Can Go if $0.6 Fails (Ripple Price Analysis) appeared first on CryptoPotato.
Read More