RaveDAO Price Prediction: Why Did RAVE Surge 2500% In Ten Days?
Share:
RAVE surged to $8.98 on Apr 13 (+~43%), trading as high as $9.96 after moving from $0.21 on Apr 3; RSI 99.18 and price sits $3.30 above the upper Bollinger Band (upper band $5.69). $134M of short positions were liquidated on Apr 11, open interest spiked to $515M and funding rates turned negative — classic crypto derivatives-driven short squeeze and heightened liquidation risk. Rally occurred with no fundamental catalyst (no protocol upgrade, partnership, token launch), signaling high short-term volatility and downside risk for token price and adoption metrics.
Predictions Markets
See what traders are focused on

- RAVE trades at $8.98, up 42.67%, with RSI at 99.18 and price trading $3.30 above the upper Bollinger Band at $5.69.
- $134M in shorts liquidated on April 11 alone, OI surged to $515M with funding rates negative confirming a squeeze.
- RAVE has risen from $0.14 to $9.96 in four months with zero fundamental catalyst behind the move.
RAVE trades at $8.98 on April 13, up 43%, after a short squeeze wiped $134M in open interest on April 11 and drove the token from $0.21 on April 3 to a session high of $9.96 today, all without a single fundamental catalyst.
Is RAVE’s Rally Real Or Just A Short Squeeze Playing Out?
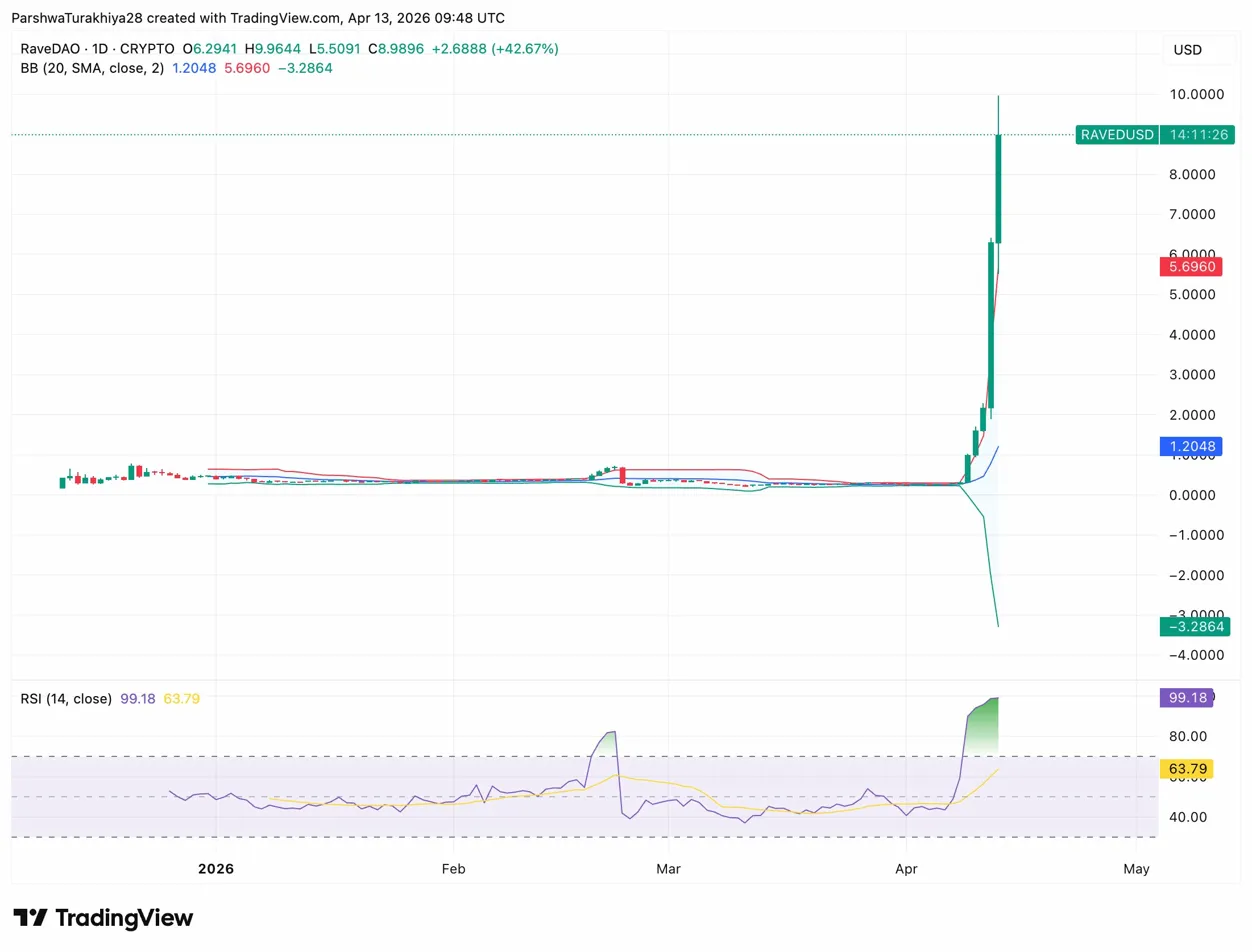
The daily chart answers the question bluntly. RAVE traded flat near $0.20 to $0.30 from January through early April with the Bollinger Bands compressed tight, upper band at $5.69, middle at $1.20, lower at -$3.28. …
Read The Full Article RaveDAO Price Prediction: Why Did RAVE Surge 2500% In Ten Days? On Coin Edition.


Read More
Litecoin (LTC) Price Prediction 2026-2030: Will LTC Hit $80 Soon?