


Dogecoin Follows The Blueprint: Analyst Highlights Perfect Technical Execution
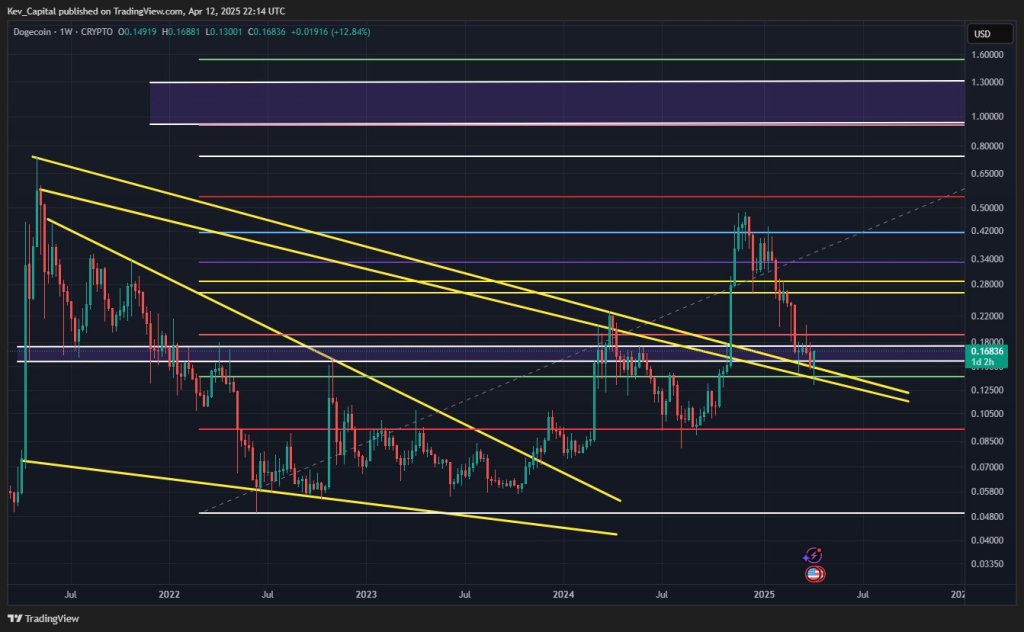
Dogecoin’s price action continues to honor the technical “blueprint” laid out by crypto analyst Kevin (@Kev_Capital_TA), who reaffirmed on Sunday that his strategic roadmap from March 22 remains intact. The weekly chart reveals an extended descending channel drawn with multiple yellow trend lines that originated in 2021 and constricted price action throughout 2022.
Within that formation, the most critical horizontal threshold appears to be $0.139, labeled on the chart as the “Last line in the sand” and described by Kevin as essential for preserving bullish market structure. He notes that maintaining durable weekly closes above this zone is paramount for further upside, while a decisive break beneath $0.139 would nullify the bullish thesis.
Dogecoin Follows The Blueprint
Dogecoin’s retracement from highs near $0.45 earlier this year has so far been contained by a confluence of support channels and Fibonacci retracement levels. According to Kevin’s chart, the primary Fib levels span from roughly $0.049 at the lower bound (0% Fib) to around $2.268 at the 1.414 extension.
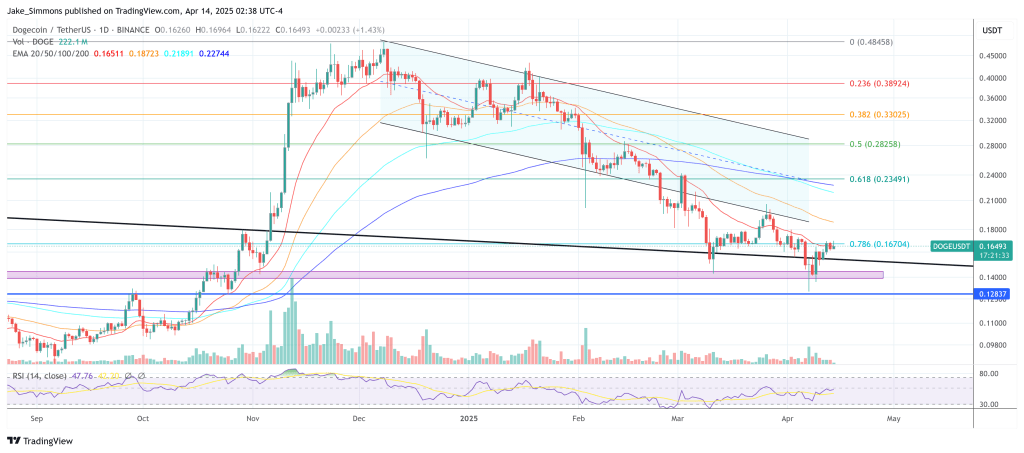
Closer inspection shows intermediate Fibonacci markers at $0.090 (0.236), $0.138 (0.382), $0.190 (0.50), $0.262 (0.618), $0.413 (0.786), $0.542 (0.88), $0.738 (1.0), $0.934 (1.0866), and $1.543 (1.272). Since the price is hovering near $0.16–$0.17 at press time, Dogecoin has remained above the 0.382 retracement near $0.138, reinforcing Kevin’s argument that the risk-reward ratio at this level appears “absolutely phenomenal.”
Kevin’s March 22 update describes the confluence of several higher time frame indicators, including the Weekly Stochastic RSI, the 3-Day MACD, and the 2-Week Stochastic RSI, all of which he sees nearing full resets. He cites the previous weekly demand candle, which formed just above $0.139, as a key sign that buyers are stepping in to defend what he calls “the Last line of bull market support.”
The Weekly Stoch RSI on his chart is already situated at low levels, while the 3-Day MACD and 2-Week Stoch RSI appear roughly a month away from bottoming out. According to Kevin, these technical resets should serve as a springboard for Dogecoin’s next significant upward move, provided that Bitcoin, which he believes must hold above $70K in his scenario, remains stable enough to support broader market strength.
On Sunday, Kevin reminded his audience that this strategy, first made public on March 22, is going “exactly according to plan,” given Dogecoin’s confirmed bounce around the $0.139 region and the ongoing drift toward oversold conditions in multiple momentum gauges. He disclosed that his Patreon trading portfolio holds an average entry at $0.15 for this swing and noted that a swift rejection of sub-$0.139 weekly closes, coupled with the bullish stance of the higher time frame indicators, corroborates his confidence in Dogecoin’s recovery potential.
While he acknowledges that “lots of work” still needs to be done for Dogecoin to reclaim loftier levels near the 0.618 Fib around $0.262 or even the 0.786 Fib at $0.413, Kevin maintains that his initial thesis stands as long as the meme-inspired asset preserves its foothold above $0.139. For him, the risk of a breakdown is well-defined if the pivotal support gives way, but should the level persist, he sees the upside potential extending far beyond the current range. As of now, Dogecoin’s price continues to cling to that all-important line in the sand, keeping Kevin’s bullish blueprint very much alive.
At press time, DOGE traded at $0.16493.
Read More

Dogecoin Price To Enter Phase E After Testing Last Point Of Support, Here’s The Target
Dogecoin Whales Buy 800 Million DOGE in 48 Hours – Smart Money Or Bull Trap?
Dogecoin Follows The Blueprint: Analyst Highlights Perfect Technical Execution
Dogecoin’s price action continues to honor the technical “blueprint” laid out by crypto analyst Kevin (@Kev_Capital_TA), who reaffirmed on Sunday that his strategic roadmap from March 22 remains intact. The weekly chart reveals an extended descending channel drawn with multiple yellow trend lines that originated in 2021 and constricted price action throughout 2022.
Within that formation, the most critical horizontal threshold appears to be $0.139, labeled on the chart as the “Last line in the sand” and described by Kevin as essential for preserving bullish market structure. He notes that maintaining durable weekly closes above this zone is paramount for further upside, while a decisive break beneath $0.139 would nullify the bullish thesis.
Dogecoin Follows The Blueprint
Dogecoin’s retracement from highs near $0.45 earlier this year has so far been contained by a confluence of support channels and Fibonacci retracement levels. According to Kevin’s chart, the primary Fib levels span from roughly $0.049 at the lower bound (0% Fib) to around $2.268 at the 1.414 extension.
Closer inspection shows intermediate Fibonacci markers at $0.090 (0.236), $0.138 (0.382), $0.190 (0.50), $0.262 (0.618), $0.413 (0.786), $0.542 (0.88), $0.738 (1.0), $0.934 (1.0866), and $1.543 (1.272). Since the price is hovering near $0.16–$0.17 at press time, Dogecoin has remained above the 0.382 retracement near $0.138, reinforcing Kevin’s argument that the risk-reward ratio at this level appears “absolutely phenomenal.”
Kevin’s March 22 update describes the confluence of several higher time frame indicators, including the Weekly Stochastic RSI, the 3-Day MACD, and the 2-Week Stochastic RSI, all of which he sees nearing full resets. He cites the previous weekly demand candle, which formed just above $0.139, as a key sign that buyers are stepping in to defend what he calls “the Last line of bull market support.”
The Weekly Stoch RSI on his chart is already situated at low levels, while the 3-Day MACD and 2-Week Stoch RSI appear roughly a month away from bottoming out. According to Kevin, these technical resets should serve as a springboard for Dogecoin’s next significant upward move, provided that Bitcoin, which he believes must hold above $70K in his scenario, remains stable enough to support broader market strength.
On Sunday, Kevin reminded his audience that this strategy, first made public on March 22, is going “exactly according to plan,” given Dogecoin’s confirmed bounce around the $0.139 region and the ongoing drift toward oversold conditions in multiple momentum gauges. He disclosed that his Patreon trading portfolio holds an average entry at $0.15 for this swing and noted that a swift rejection of sub-$0.139 weekly closes, coupled with the bullish stance of the higher time frame indicators, corroborates his confidence in Dogecoin’s recovery potential.
While he acknowledges that “lots of work” still needs to be done for Dogecoin to reclaim loftier levels near the 0.618 Fib around $0.262 or even the 0.786 Fib at $0.413, Kevin maintains that his initial thesis stands as long as the meme-inspired asset preserves its foothold above $0.139. For him, the risk of a breakdown is well-defined if the pivotal support gives way, but should the level persist, he sees the upside potential extending far beyond the current range. As of now, Dogecoin’s price continues to cling to that all-important line in the sand, keeping Kevin’s bullish blueprint very much alive.
At press time, DOGE traded at $0.16493.
Read More
Dogecoin Price To Enter Phase E After Testing Last Point Of Support, Here’s The Target