Ethereum Price Analysis: ETH Gains 3% Daily but Faces Critical Resistance
Share:
Predictions Markets
See what traders are focused on

Ethereum is witnessing heightened buying activity near the 100-day moving average at $3.2K, fueling optimism for a bullish breakout.
The asset appears poised to challenge the critical $3.5K resistance zone, a decisive level that could dictate its mid-term trajectory.
Technical Analysis
By Shayan
The Daily Chart
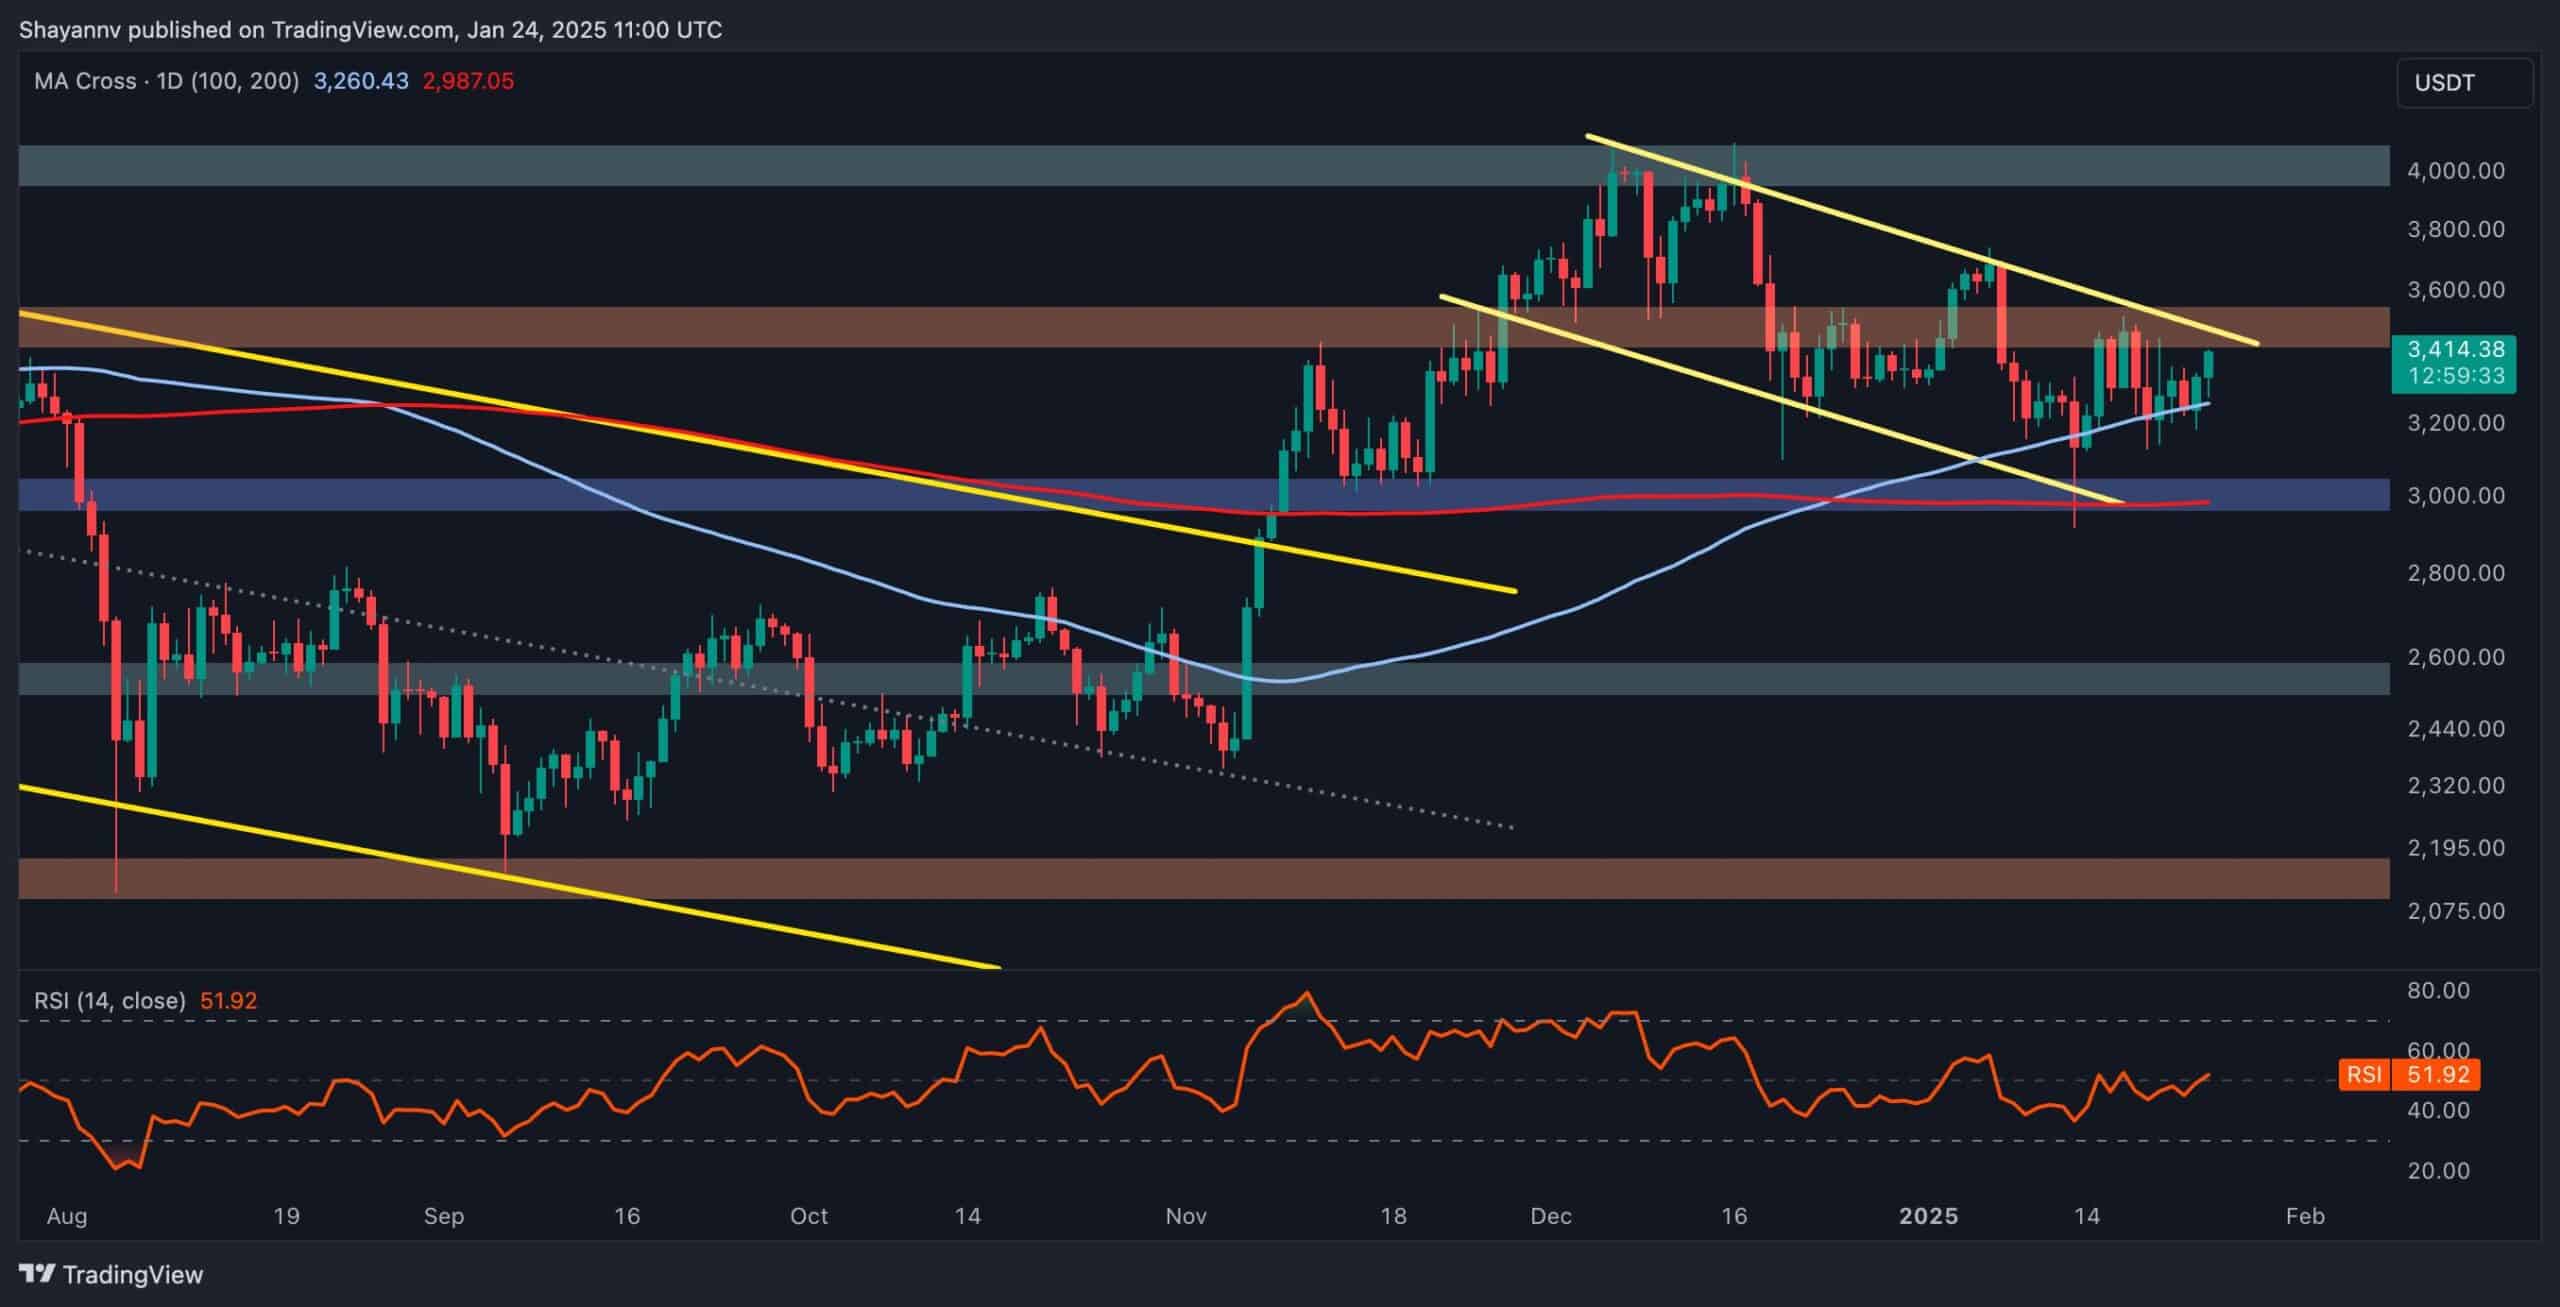
Ethereum has been consolidating within a tight range defined by the 100-day moving average at $3.2K and the significant $3.5K resistance zone, which also aligns with the upper boundary of a bullish flag pattern. The recent rebound from the 100-day MA suggests growing demand, pushing the price toward the upper boundary of this range.
A breakout above the $3.5K threshold would likely signal a bullish trend continuation, targeting the $4K swing high. However, a rejection at this level could lead to a period of heightened volatility and potential consolidation near the current range. The next few days will be pivotal in shaping ETH’s trajectory, with a breakout appearing increasingly probable given the prevailing bullish sentiment.
The 4-Hour Chart
On the lower timeframe, Ethereum recently consolidated around the 0.5 Fibonacci retracement level ($3.2K), signaling a balance between buyers and sellers. Subsequently, the asset gained upward momentum, slightly breaching the descending wedge’s upper boundary and confirming a short-term bullish reversal.
Despite this progress, Ethereum encounters a robust resistance zone at $3.5K, where significant supply pressure could emerge. A likely scenario involves a brief surge to this level and a pullback toward the wedge’s broken upper boundary to validate the breakout. Should this pullback attract sufficient buying interest, Ethereum could reclaim the $3.5K level, setting the stage for a rally toward the $4K resistance zone.
The upcoming price action will be critical, with Ethereum’s ability to clear the $3.5K resistance determining the sustainability of its bullish momentum.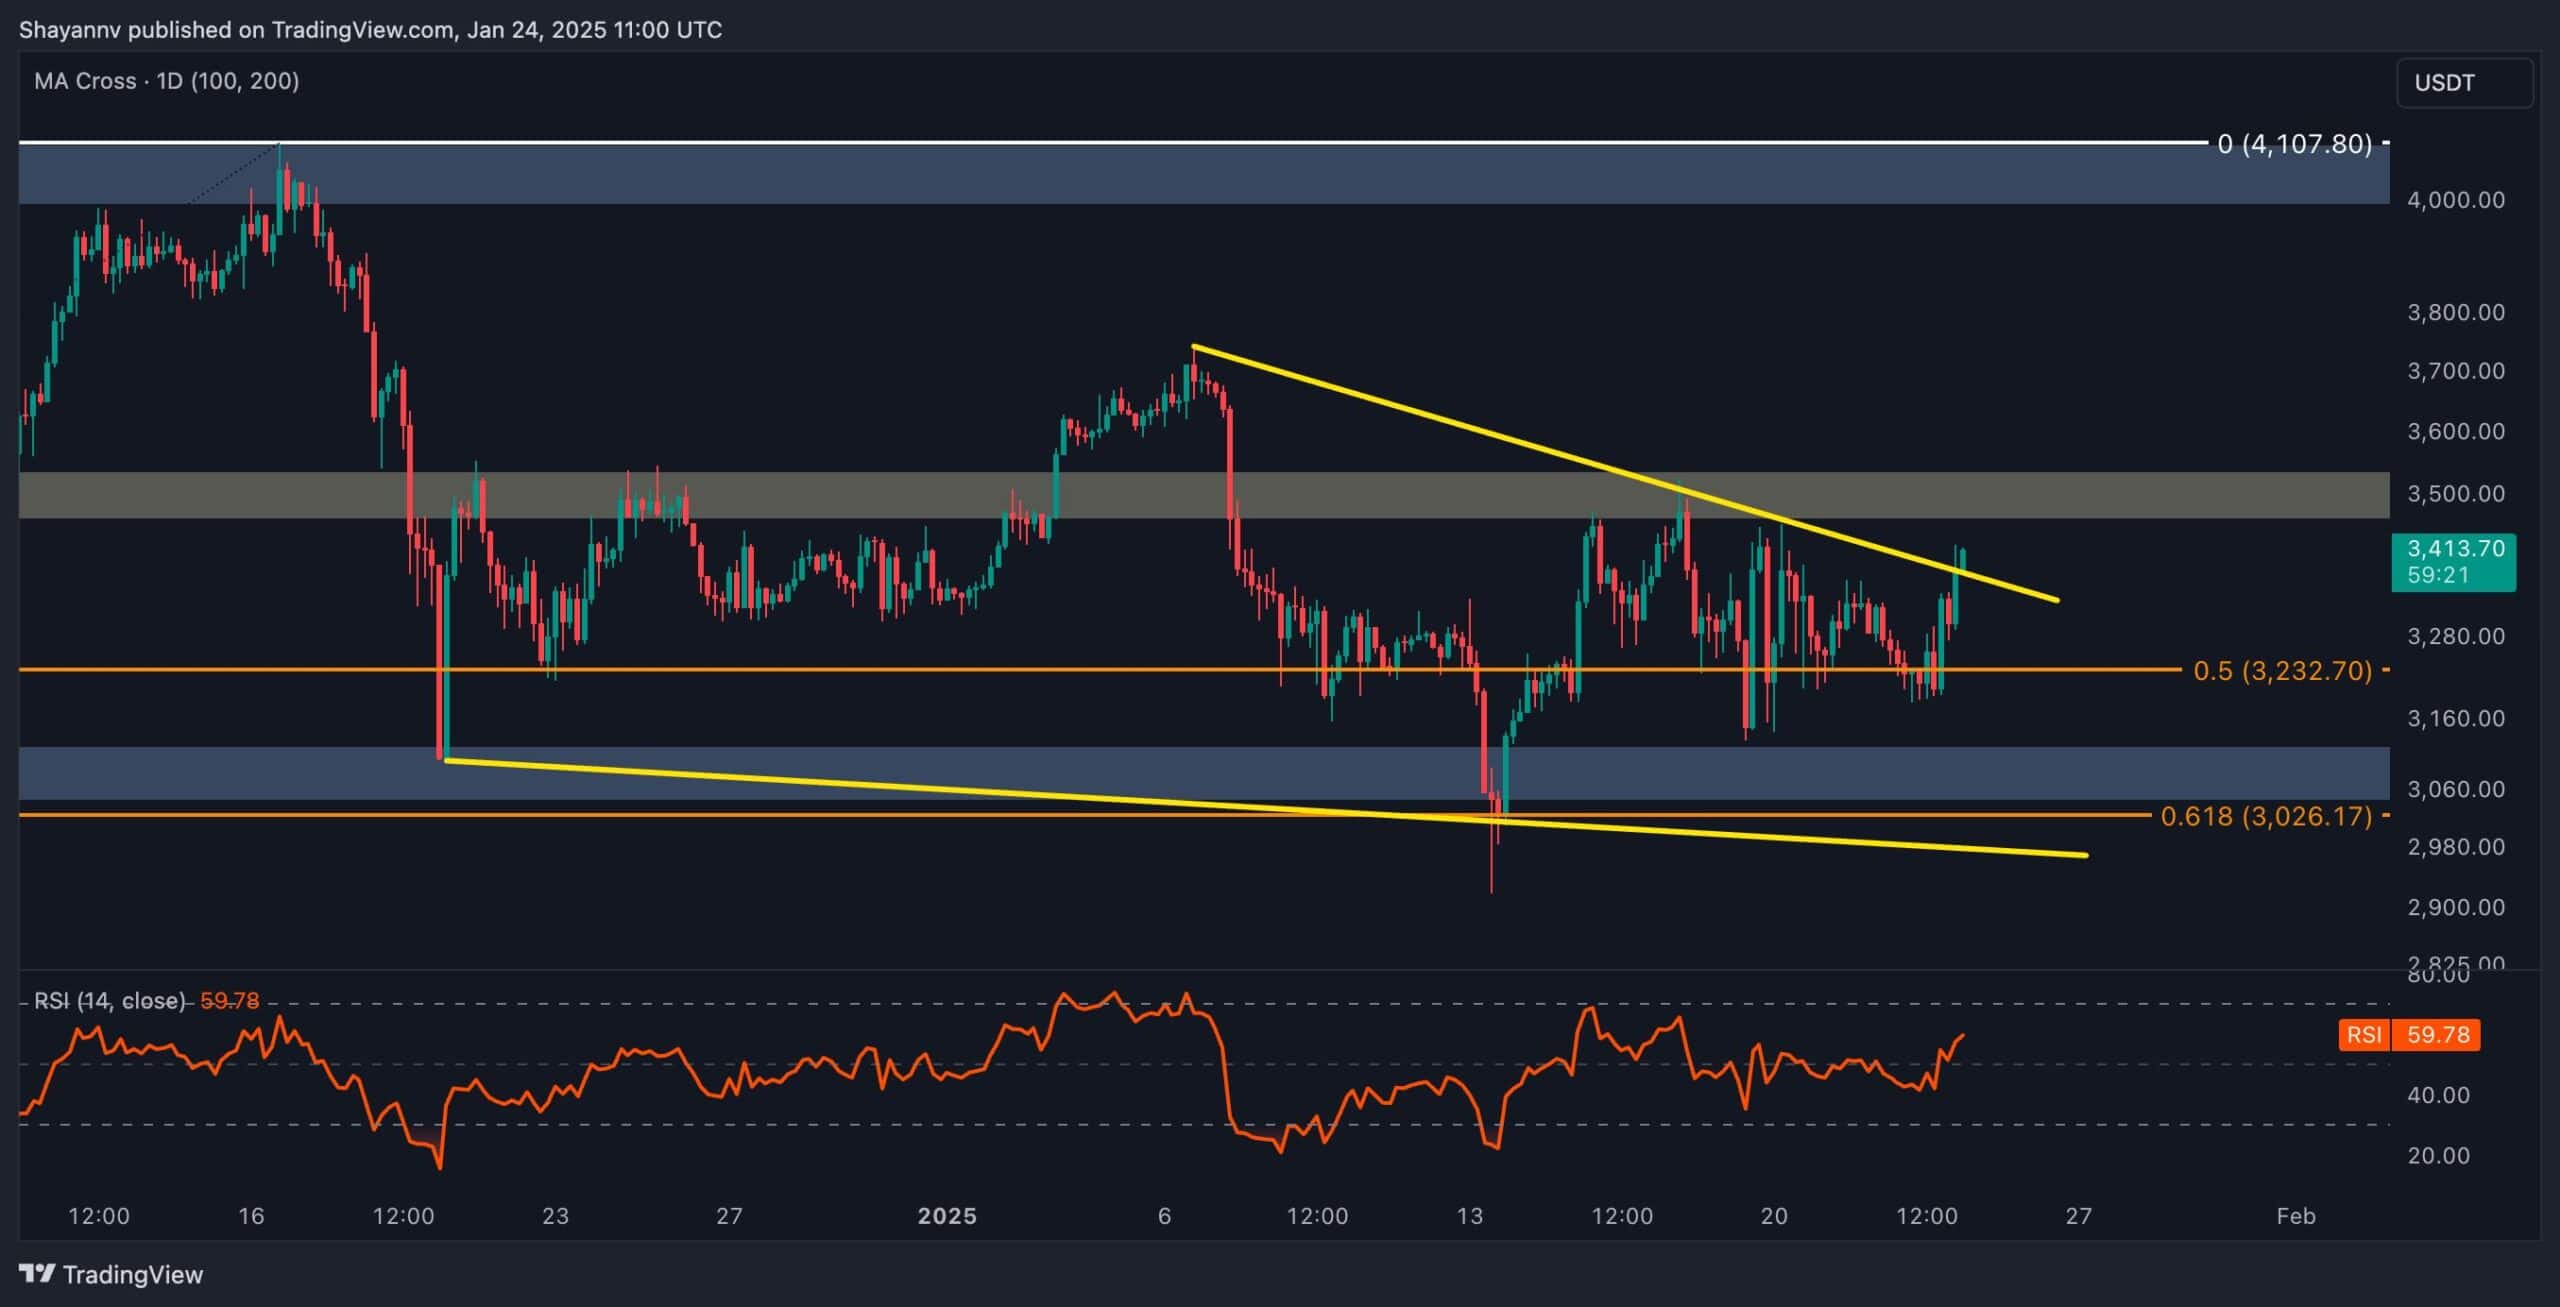
Onchain Analysis
By Shayan
The open interest metric, which tracks the number of active futures contracts across all exchanges, has been on a steady rise in recent weeks, reaching its highest values. This indicates growing participation in the futures market, with traders aggressively opening new long positions.
Interestingly, there is a divergence between Ethereum’s price and futures market activity. Despite the significant increase in open interest, the price has yet to break its previous highs, showcasing a potential imbalance between market expectations and price action.
The elevated open interest signals a higher likelihood of liquidation cascades, which often accompany sudden price movements. This could result in an explosive short-term price action, with the market likely choosing a decisive direction.
While the direction of the breakout remains uncertain, the prevailing sentiment and activity suggest a bullish breakout as the most probable scenario. If ETH successfully overcomes key resistance levels, it could set the stage for a sustained rally.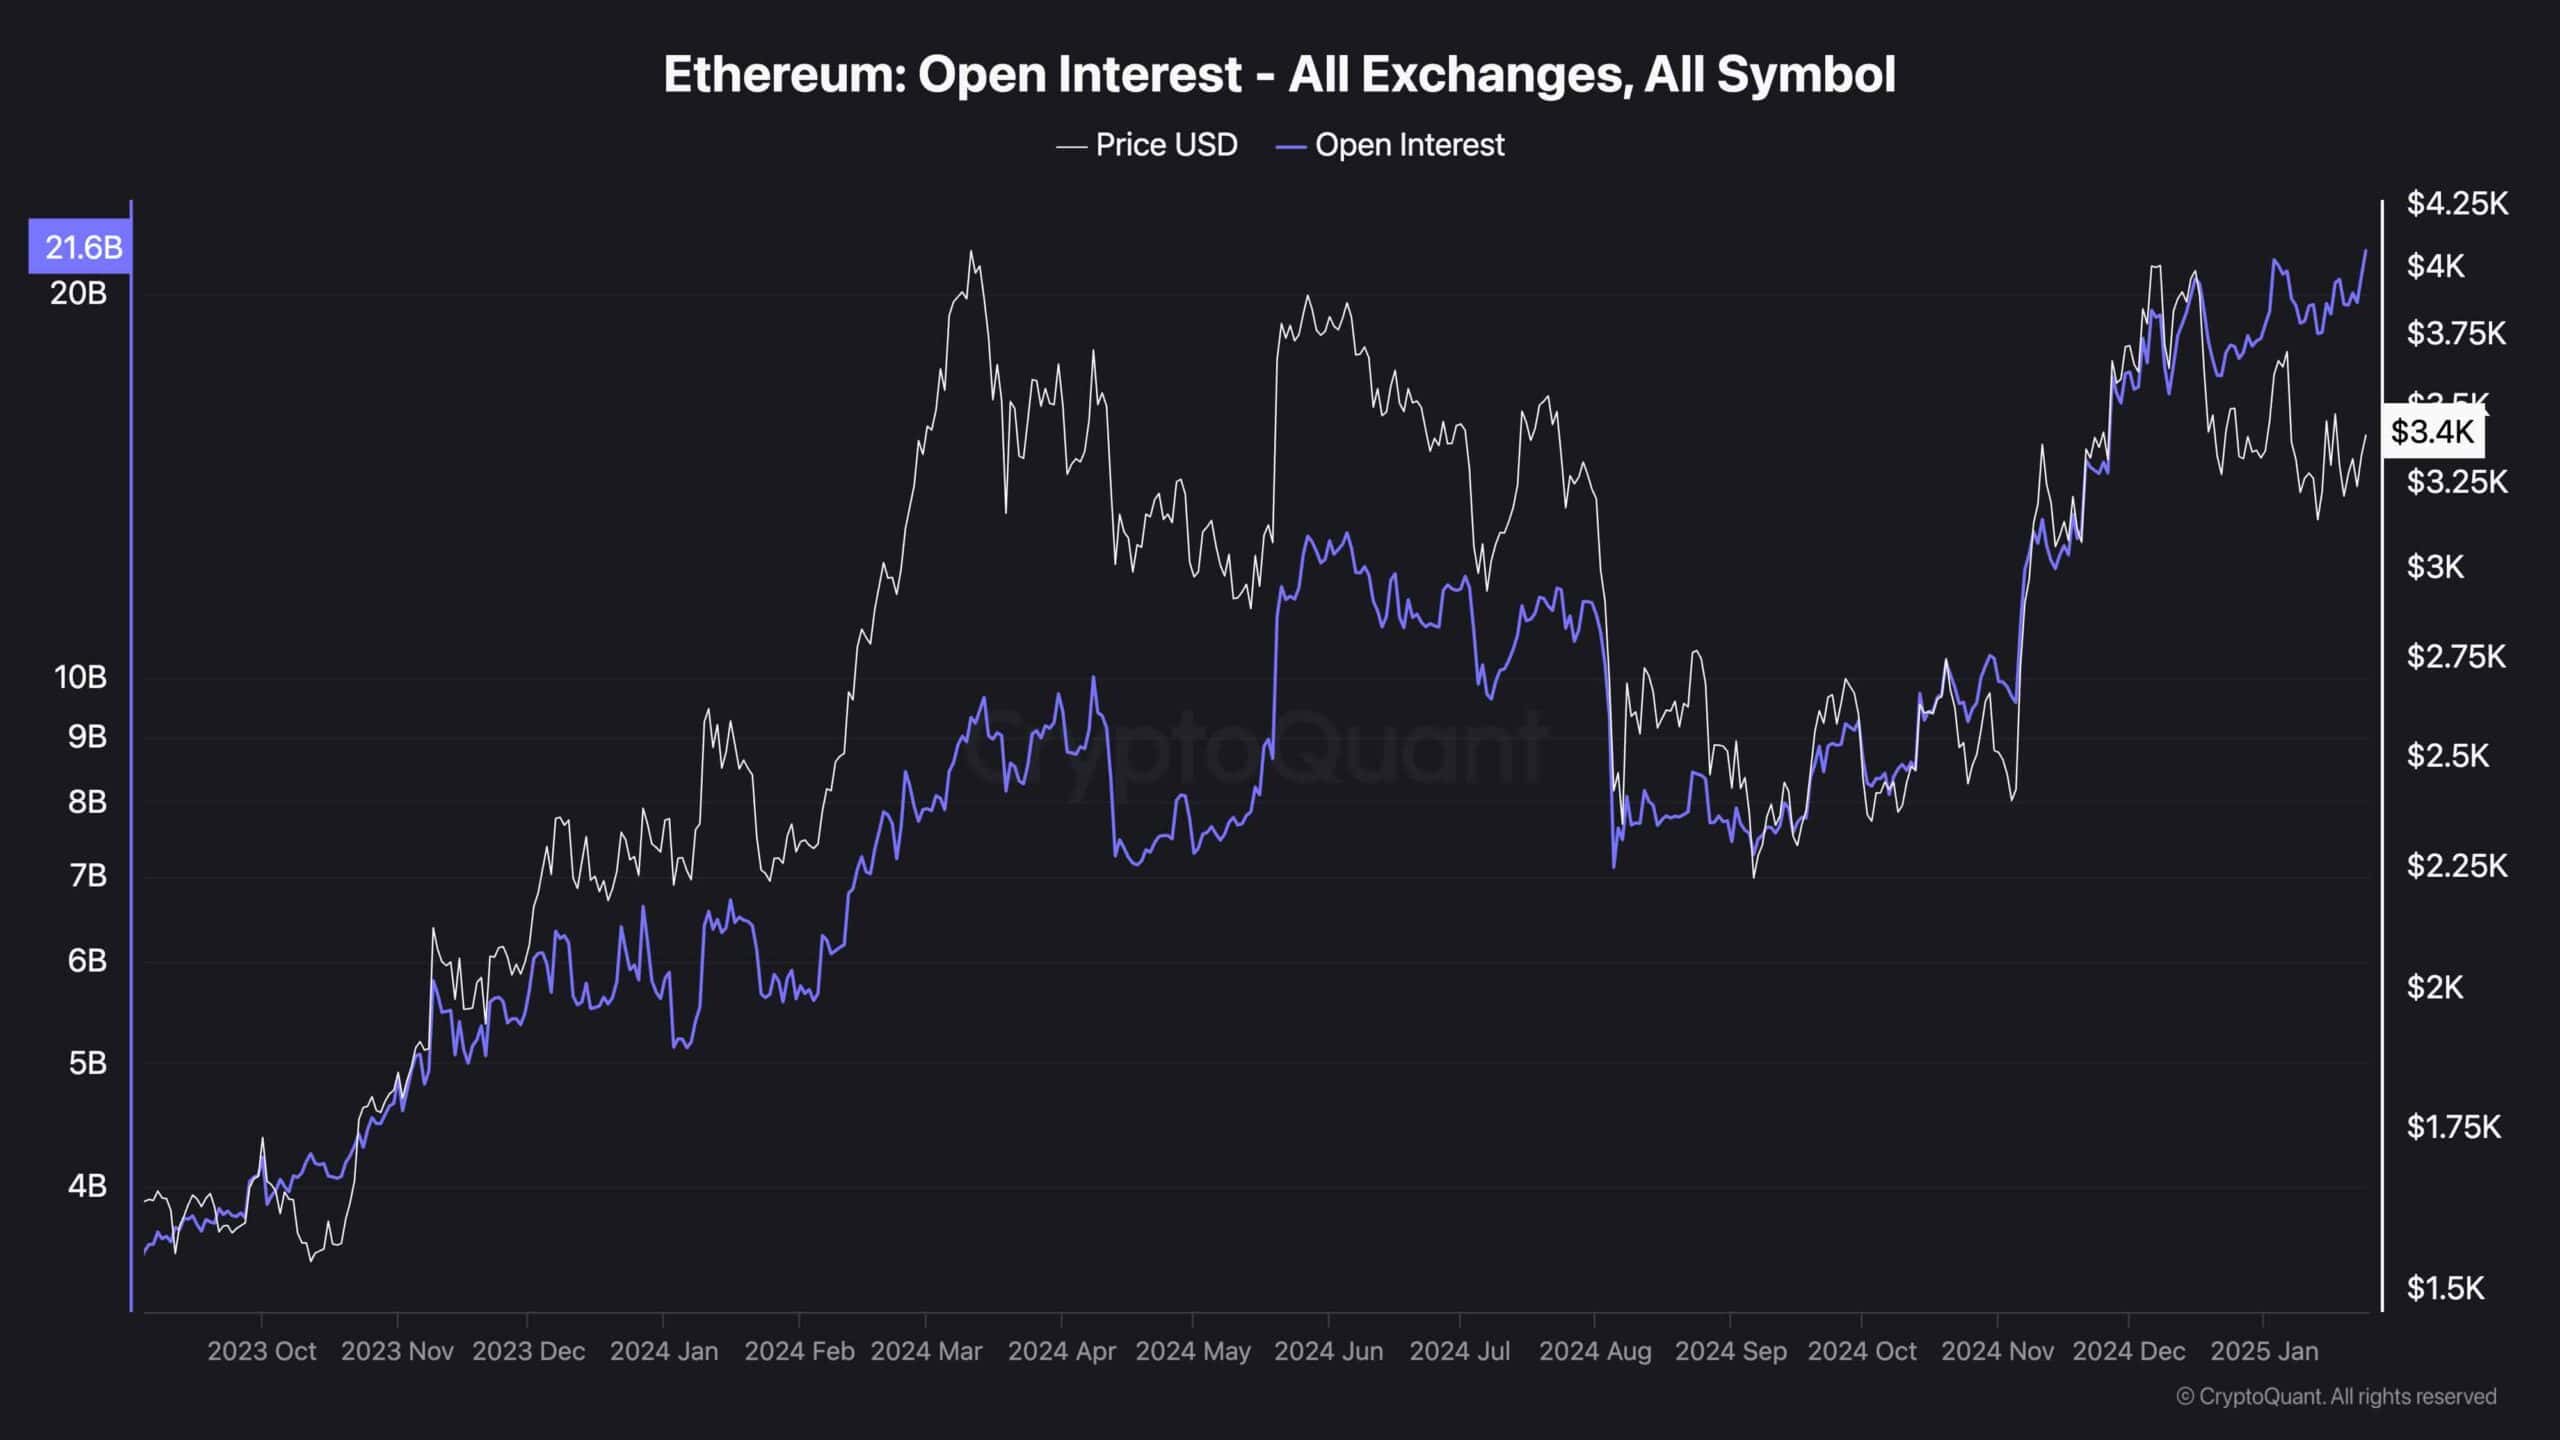
The post Ethereum Price Analysis: ETH Gains 3% Daily but Faces Critical Resistance appeared first on CryptoPotato.


Read More

Cryptocurrency Market Activity: Bitcoin Surpasses $64,000, Whale Activity is High! Here are the Altcoins They’re Trading