Bitcoin Price Holds at $111k, Are the Bears Eyeing at $93k?

The post Bitcoin Price Holds at $111k, Are the Bears Eyeing at $93k? appeared first on Coinpedia Fintech News
Bitcoin’s price has slipped to around $111,000, down 1.39% over the past 24 hours. This is with the market cap at $2.21 trillion and trading volume off 8.28%. BTC is testing critical support levels after failing to hold its 7-day and 30-day SMAs. Thereby, raising the risk of accelerated selling pressure.
While the current 11.4% drawdown from the ATH is shallow by Bitcoin’s historical standards, on-chain signals and macro headwinds hint at fragility beneath the surface.
On-Chain Insights
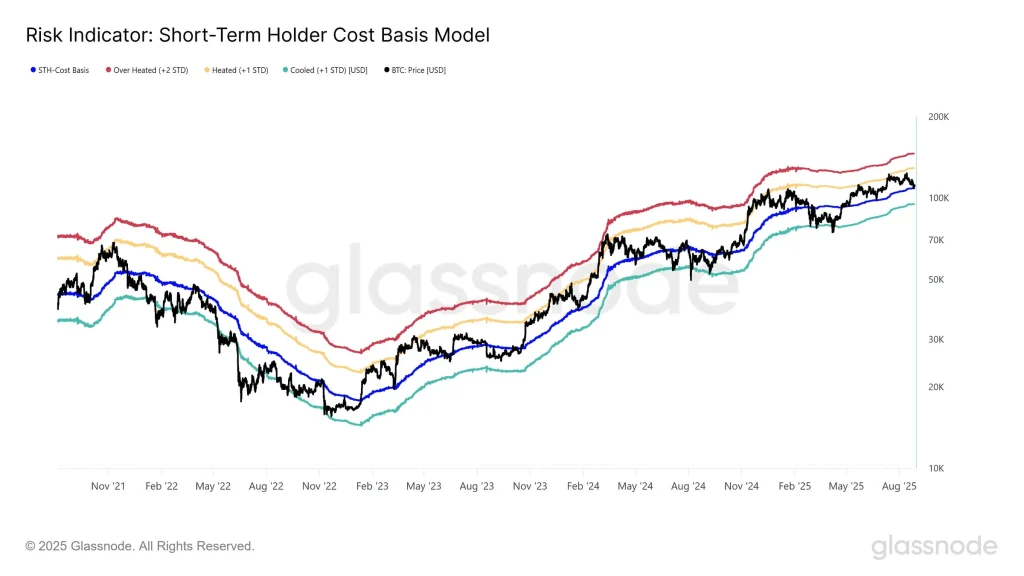
As per Glassnode, Bitcoin is trading just below the short-term holder cost basis near $108.9k. Historically, dips below this level have preceded multi-month bearish phases. If BTC price fails to hold $107k–$108.9k, statistical risk bands suggest a mid-term bottom could form between $93k and $95k.

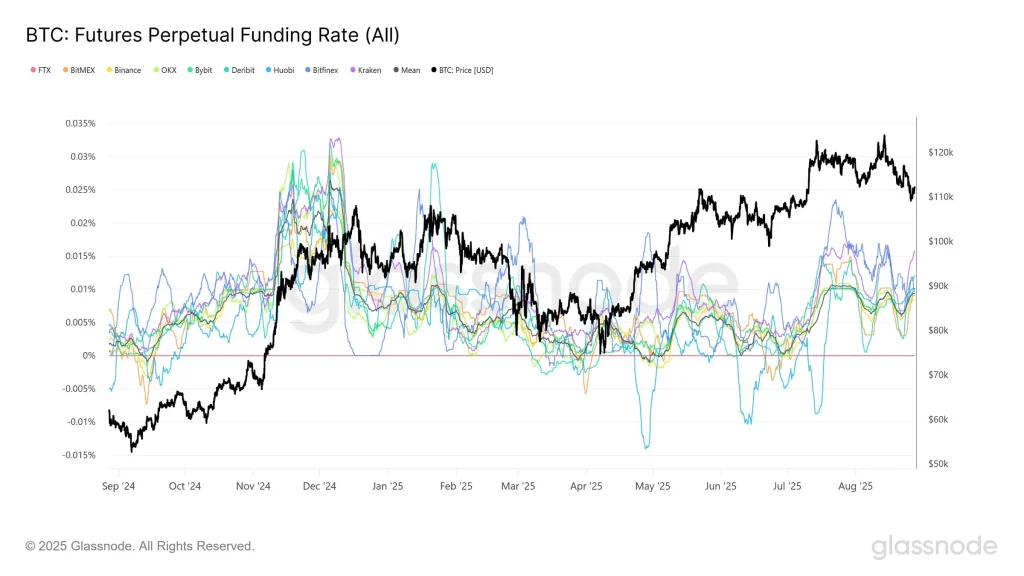
The pullback remains moderate, as the past mid-cycle corrections exceeded 25%. This occurred during deep capitulation events, which slashed prices by over 75%. The relatively mild drop indicates no widespread panic selling yet, but the lack of strong spot demand and the fragile posture of perpetuals around a 0.01% funding rate suggest caution. Traders attempting to “buy the dip” are doing so with low conviction, leaving the market vulnerable to sudden sentimental shifts.

Adding to the pressure, several large BTC transfers hit exchanges this week. These include a 330 BTC, worth about $39M move from a 12.3-year dormant wallet and repeated 4,000–6,000 BTC deposits to Coinbase. While such inflows don’t guarantee immediate liquidation, they raise available supply on trading venues. The Exchange Whale Ratio spiking to 0.50 historically aligns with near-term price weakness.
BTC Price Analysis
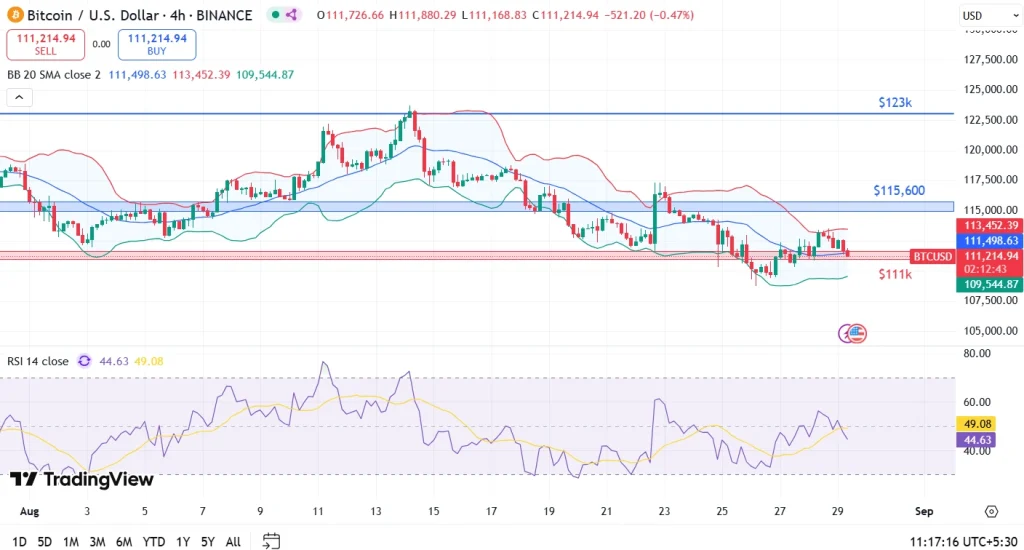
Technically speaking, Bitcoin’s price breakdown below the 7-day SMA at $113,057 and the 30-day SMA at $115,600 has triggered bearish momentum. The MACD histogram at –568.92 and RSI at 44.6 further confirm downside bias. Bitcoin price is now hovering around the 78.6% Fibonacci retracement at $112,120. A breach here increases the likelihood of a slide toward $108,762, with $107k as a critical line of defense.

A recovery toward $113.6k is possible but likely to meet resistance from stressed short-term holders seeking exit liquidity. If bulls fail to regain control quickly, a cascade toward $93k–$95k becomes a possible risk.
FAQs
It aligns with the short-term holder cost basis. Sustained trading below this level often signals deeper corrections.
Yes, if $107k fails, risk models and historical cycle behavior point to a potential mid-term bottom in that range.
Bitcoin Price Holds at $111k, Are the Bears Eyeing at $93k?

The post Bitcoin Price Holds at $111k, Are the Bears Eyeing at $93k? appeared first on Coinpedia Fintech News
Bitcoin’s price has slipped to around $111,000, down 1.39% over the past 24 hours. This is with the market cap at $2.21 trillion and trading volume off 8.28%. BTC is testing critical support levels after failing to hold its 7-day and 30-day SMAs. Thereby, raising the risk of accelerated selling pressure.
While the current 11.4% drawdown from the ATH is shallow by Bitcoin’s historical standards, on-chain signals and macro headwinds hint at fragility beneath the surface.
On-Chain Insights
As per Glassnode, Bitcoin is trading just below the short-term holder cost basis near $108.9k. Historically, dips below this level have preceded multi-month bearish phases. If BTC price fails to hold $107k–$108.9k, statistical risk bands suggest a mid-term bottom could form between $93k and $95k.

The pullback remains moderate, as the past mid-cycle corrections exceeded 25%. This occurred during deep capitulation events, which slashed prices by over 75%. The relatively mild drop indicates no widespread panic selling yet, but the lack of strong spot demand and the fragile posture of perpetuals around a 0.01% funding rate suggest caution. Traders attempting to “buy the dip” are doing so with low conviction, leaving the market vulnerable to sudden sentimental shifts.

Adding to the pressure, several large BTC transfers hit exchanges this week. These include a 330 BTC, worth about $39M move from a 12.3-year dormant wallet and repeated 4,000–6,000 BTC deposits to Coinbase. While such inflows don’t guarantee immediate liquidation, they raise available supply on trading venues. The Exchange Whale Ratio spiking to 0.50 historically aligns with near-term price weakness.
BTC Price Analysis
Technically speaking, Bitcoin’s price breakdown below the 7-day SMA at $113,057 and the 30-day SMA at $115,600 has triggered bearish momentum. The MACD histogram at –568.92 and RSI at 44.6 further confirm downside bias. Bitcoin price is now hovering around the 78.6% Fibonacci retracement at $112,120. A breach here increases the likelihood of a slide toward $108,762, with $107k as a critical line of defense.

A recovery toward $113.6k is possible but likely to meet resistance from stressed short-term holders seeking exit liquidity. If bulls fail to regain control quickly, a cascade toward $93k–$95k becomes a possible risk.
FAQs
It aligns with the short-term holder cost basis. Sustained trading below this level often signals deeper corrections.
Yes, if $107k fails, risk models and historical cycle behavior point to a potential mid-term bottom in that range.

