


BOME Price Gives Major Break, Aims 2x Surge

The post BOME Price Gives Major Break, Aims 2x Surge appeared first on Coinpedia Fintech News
Entering an intense stage of pullback after impressive listing gains, the BOME price dips 38% in April. The downfall created a triangle pattern in the daily chart and even broke below the $0.010 psychological mark.
However, as the overall market finds a boost in buying pressure, the meme coin sector is back in action. Amidst the booming sector, the BOME price presents a textbook reversal pattern, teasing a prolonged uptrend.
Book of Meme Price Performance
With a market cap of $639 Million, the Book of Meme token price is on the rise as the broader market recovers gradually. Despite a negative return of 19% in the last 30 days, the BOME price is recovering and shows a 20% growth in the last 7 days.
Tradingview
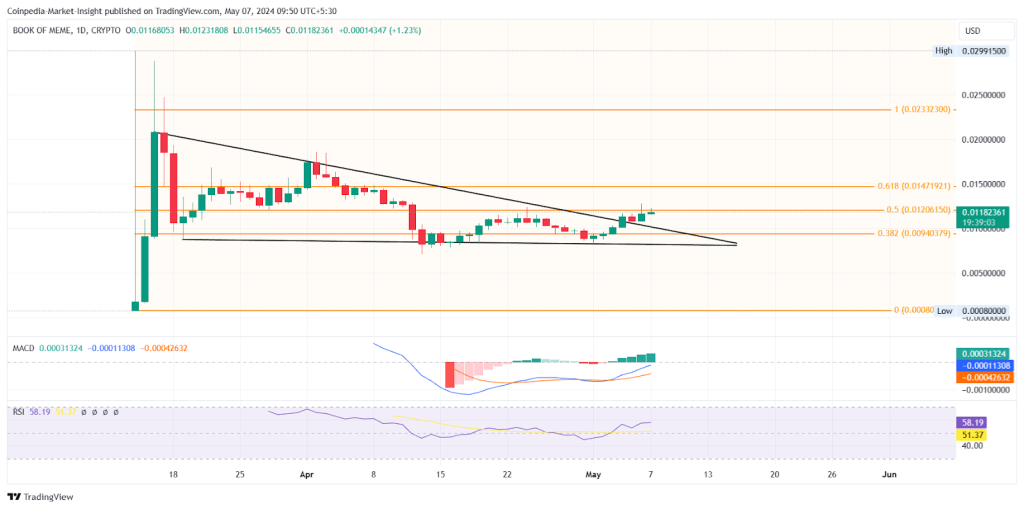
As the recovery rally gains momentum, the BOME price escapes the triangle pattern with a double-bottom reversal. With increased trading volume, the turnaround from $0.0081 reclaims the $0.010 psychological mark.
The neckline for the reversal pattern is at $0.012 and teases a bullish breakout for a prolonged uptrend. Further, as per Fibonacci, retracement over the initial bull run presents critical price levels.
Currently, the BOME price trades at $0.0115 and struggles to surpass the 50% Fibonacci level. A break above this level will signal a buying opportunity for the sideline traders to catch the next bull run.
Technical Indicators:
RSI: The RSI line shows a massive surge to the overbought zone, reflecting increased underlying demand.
MACD: The MACD and signal lines are in a positive tandem and reflect a rise in bullish histograms.
Will BOME Price Cross $0.012?
As a crucial resistance level, the ongoing brawl at the $0.012 mark will decide the upcoming BOME price trend. A breakout rally will potentially reach the $0.023 peak for a 2x surge this month. On the flip side, a reversal could put the $0.010 level at risk.
Read More


BOME Price Gives Major Break, Aims 2x Surge
The post BOME Price Gives Major Break, Aims 2x Surge appeared first on Coinpedia Fintech News
Entering an intense stage of pullback after impressive listing gains, the BOME price dips 38% in April. The downfall created a triangle pattern in the daily chart and even broke below the $0.010 psychological mark.
However, as the overall market finds a boost in buying pressure, the meme coin sector is back in action. Amidst the booming sector, the BOME price presents a textbook reversal pattern, teasing a prolonged uptrend.
Book of Meme Price Performance
With a market cap of $639 Million, the Book of Meme token price is on the rise as the broader market recovers gradually. Despite a negative return of 19% in the last 30 days, the BOME price is recovering and shows a 20% growth in the last 7 days.
Tradingview
As the recovery rally gains momentum, the BOME price escapes the triangle pattern with a double-bottom reversal. With increased trading volume, the turnaround from $0.0081 reclaims the $0.010 psychological mark.
The neckline for the reversal pattern is at $0.012 and teases a bullish breakout for a prolonged uptrend. Further, as per Fibonacci, retracement over the initial bull run presents critical price levels.
Currently, the BOME price trades at $0.0115 and struggles to surpass the 50% Fibonacci level. A break above this level will signal a buying opportunity for the sideline traders to catch the next bull run.
Technical Indicators:
RSI: The RSI line shows a massive surge to the overbought zone, reflecting increased underlying demand.
MACD: The MACD and signal lines are in a positive tandem and reflect a rise in bullish histograms.
Will BOME Price Cross $0.012?
As a crucial resistance level, the ongoing brawl at the $0.012 mark will decide the upcoming BOME price trend. A breakout rally will potentially reach the $0.023 peak for a 2x surge this month. On the flip side, a reversal could put the $0.010 level at risk.
Read More