


Bitcoin Itching for a New All-Time High But Bears Defend $72K (BTC Price Analysis)
Bitcoin’s price has recovered from the $65K level a few days ago and is en route to making a new all-time high soon.
Technical Analysis
By TradingRage
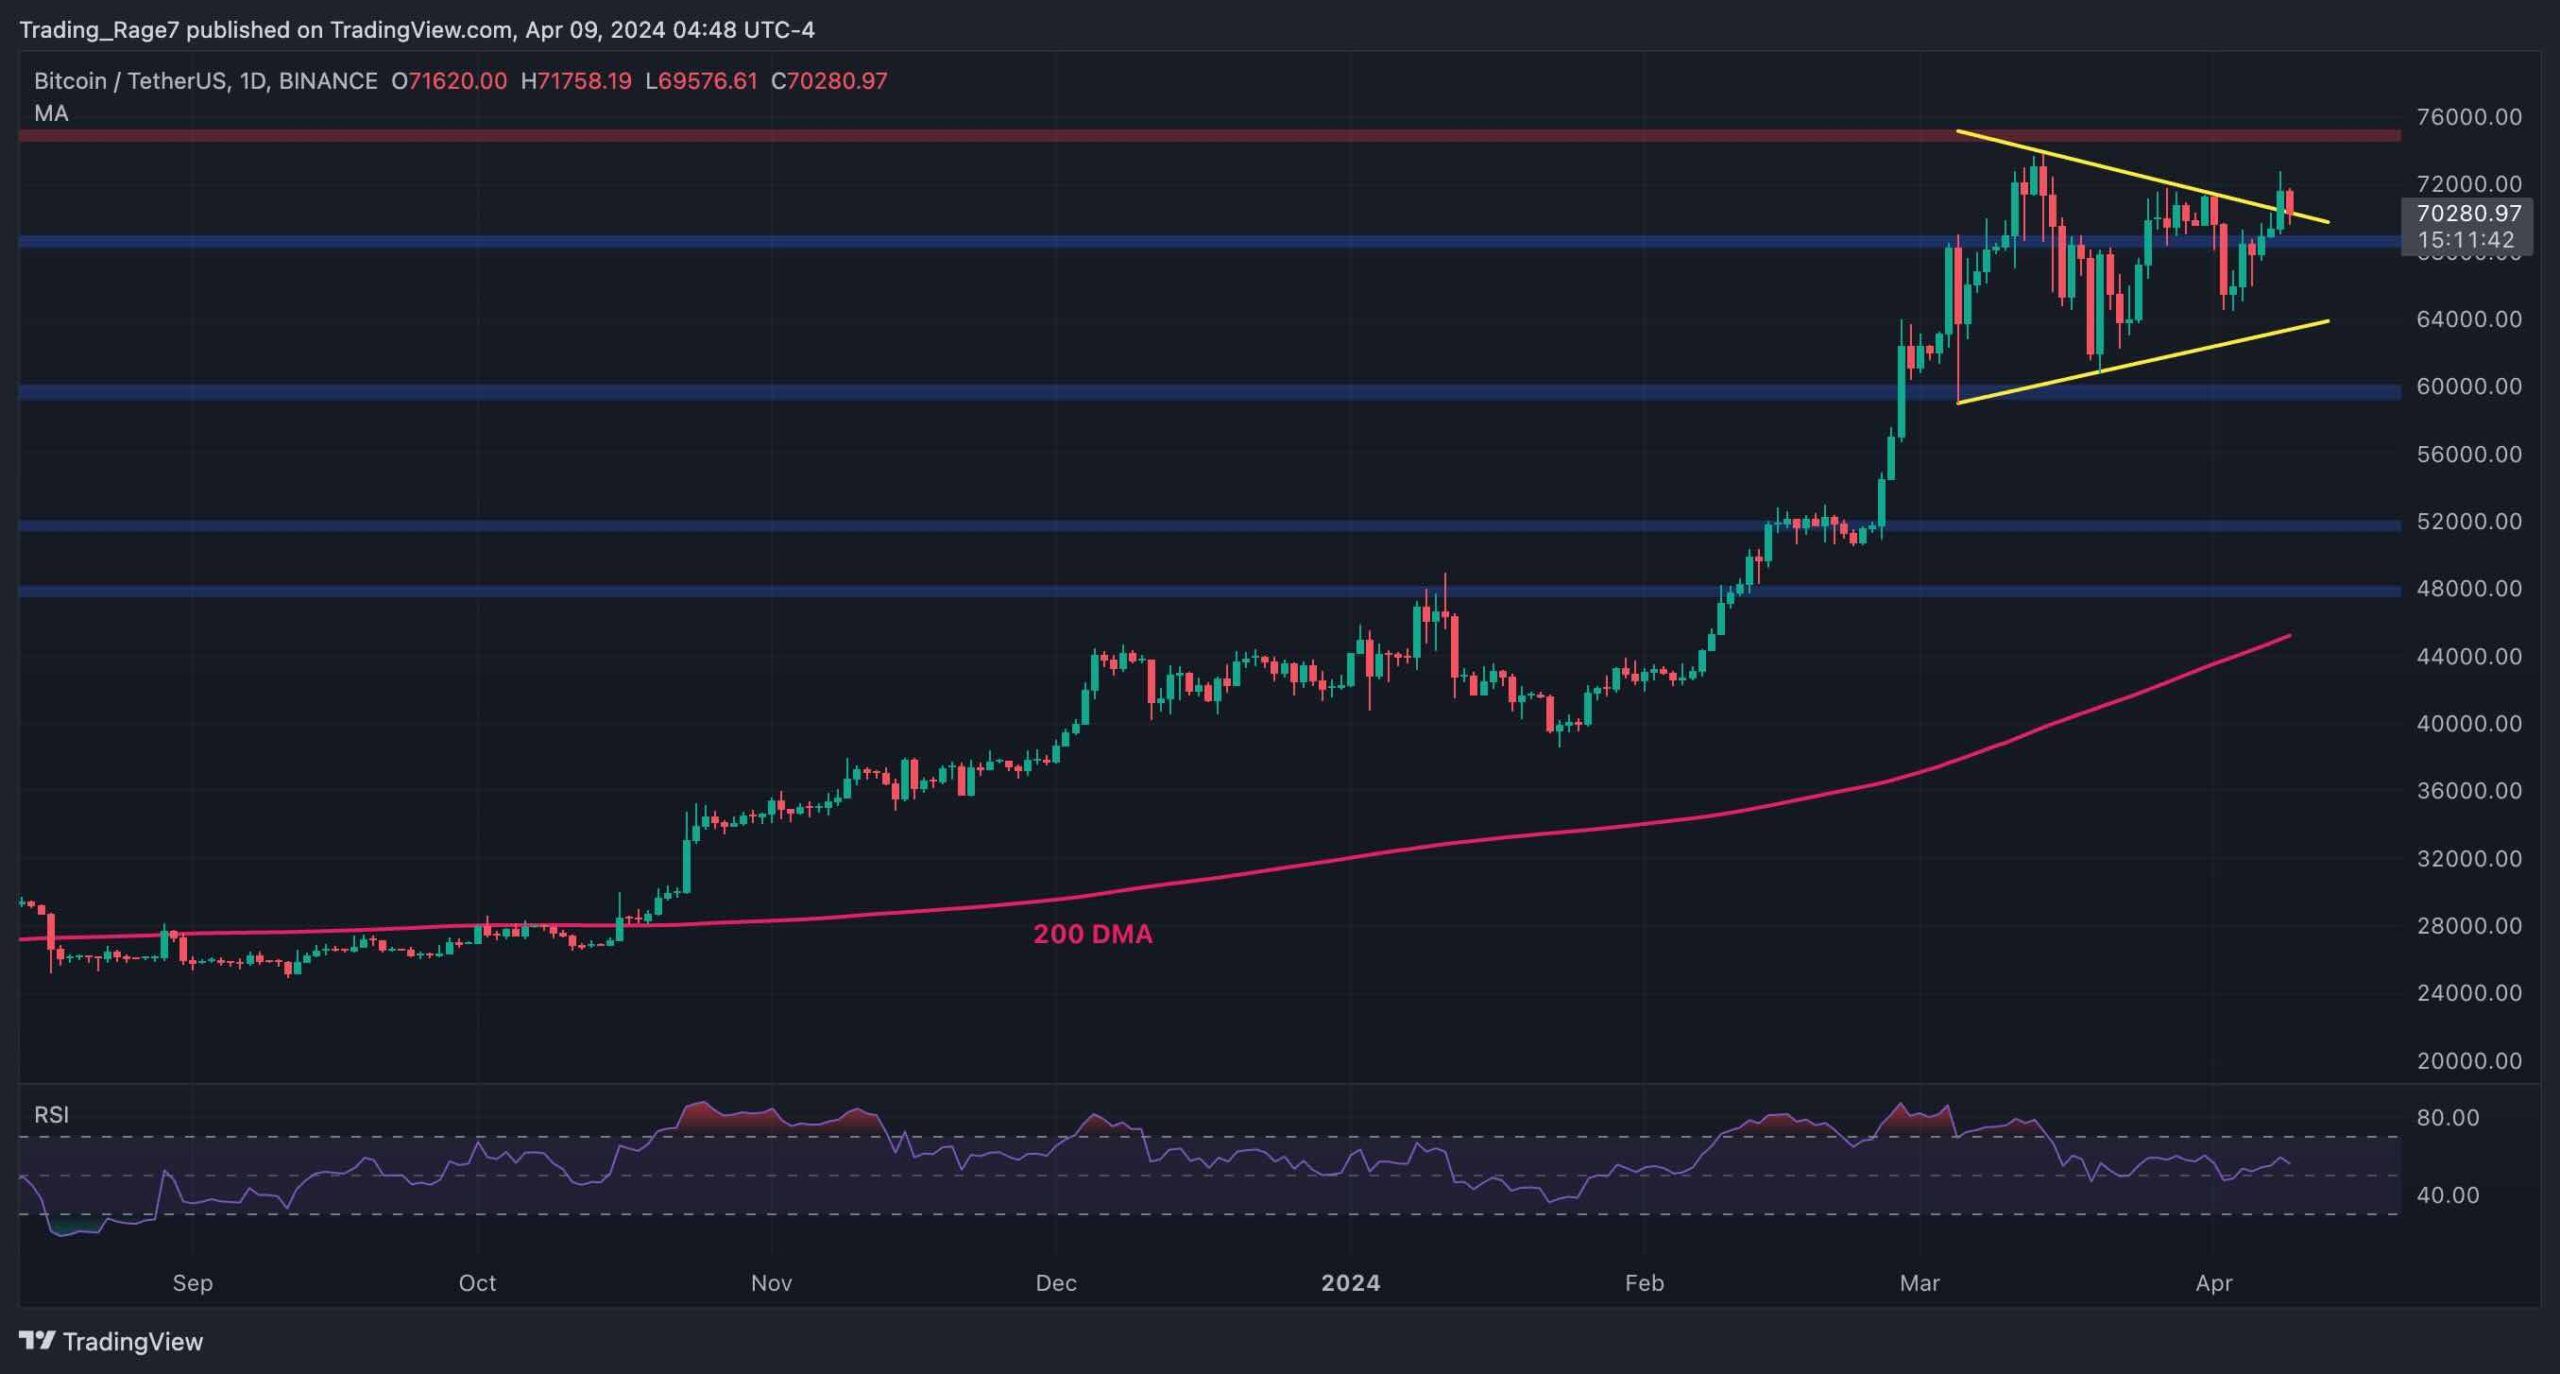
The Daily Chart
On the daily chart, the price has been forming a large symmetrical triangle pattern. Yet, the market is currently testing the higher boundary of the pattern.
If the price successfully breaks above the upper boundary, a rally toward the $75K level and creating a new all-time high would become increasingly possible. The Relative Strength Index also shows values above 50%, indicating that the momentum is bullish and a price surge is probable.
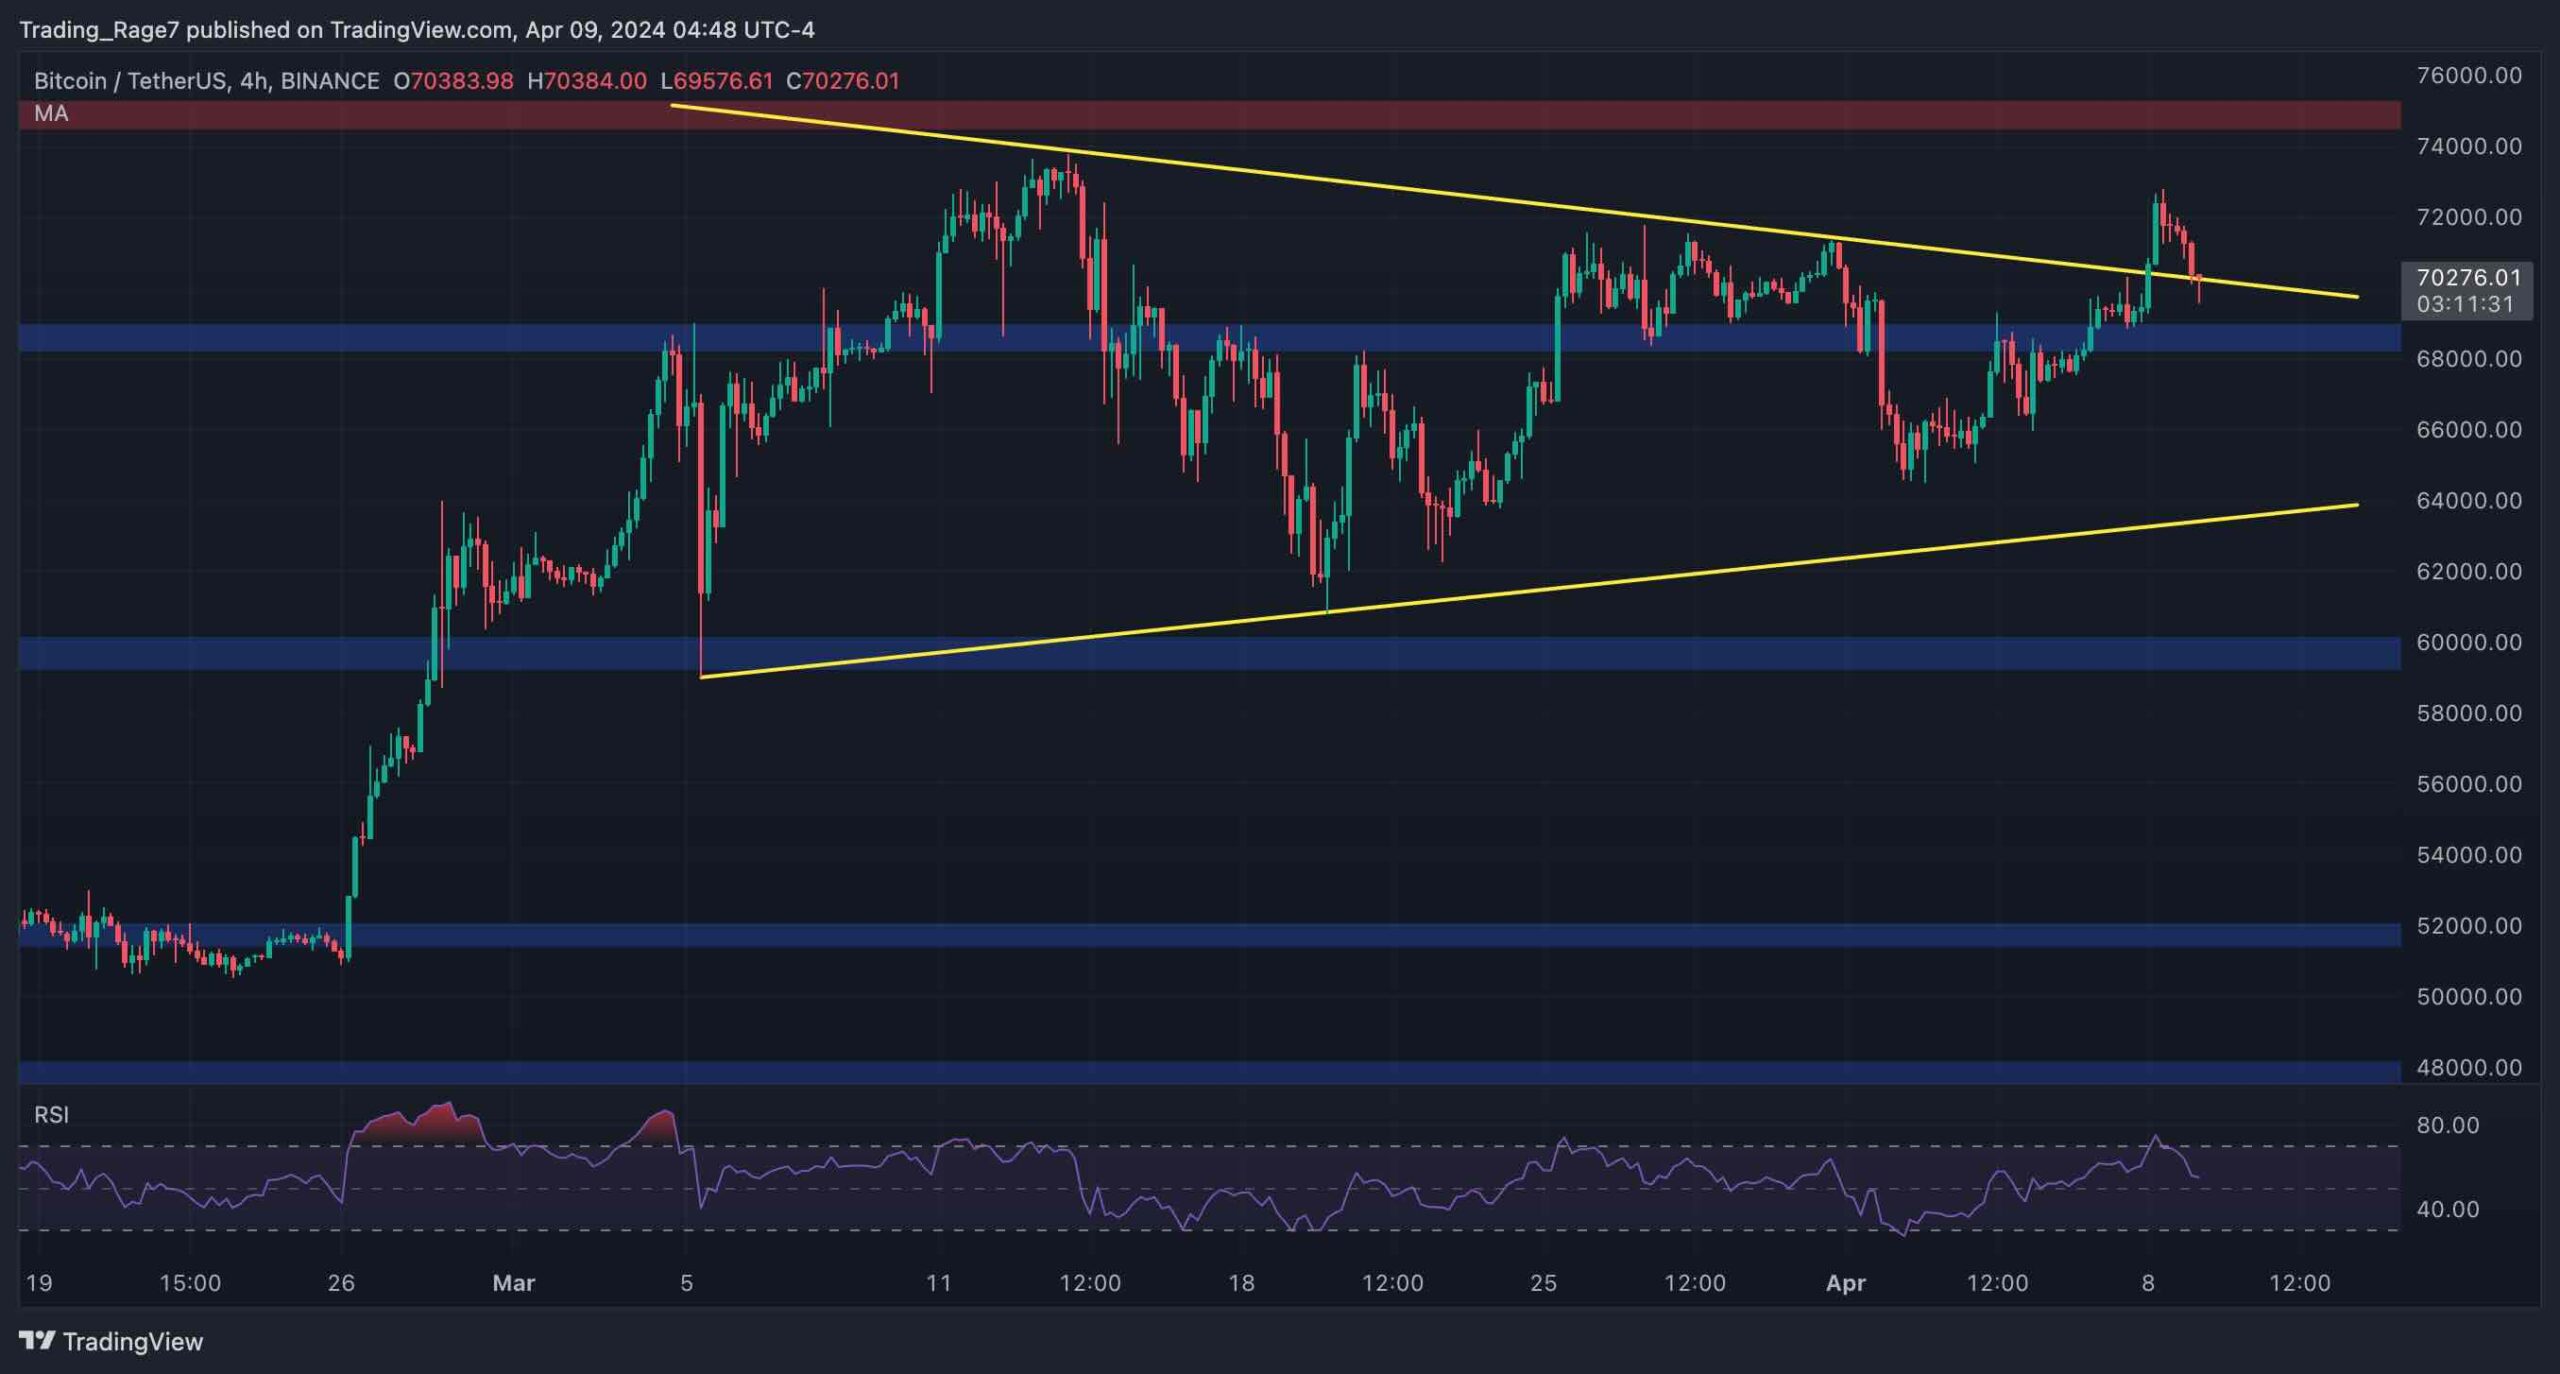
The 4-Hour Chart
Looking at the 4-hour timeframe, the price has recently broken above the triangle pattern and is currently retesting the broken trendline.
In case of a successful rebound, BTC could rise toward the $75K and probably higher. On the other hand, a drop back inside the triangle would cause the recent breakout to be a fake one. Therefore, a decline toward the lower boundary of the pattern or even the $60K support zone will become likely.
On-Chain Analysis
By TradingRage
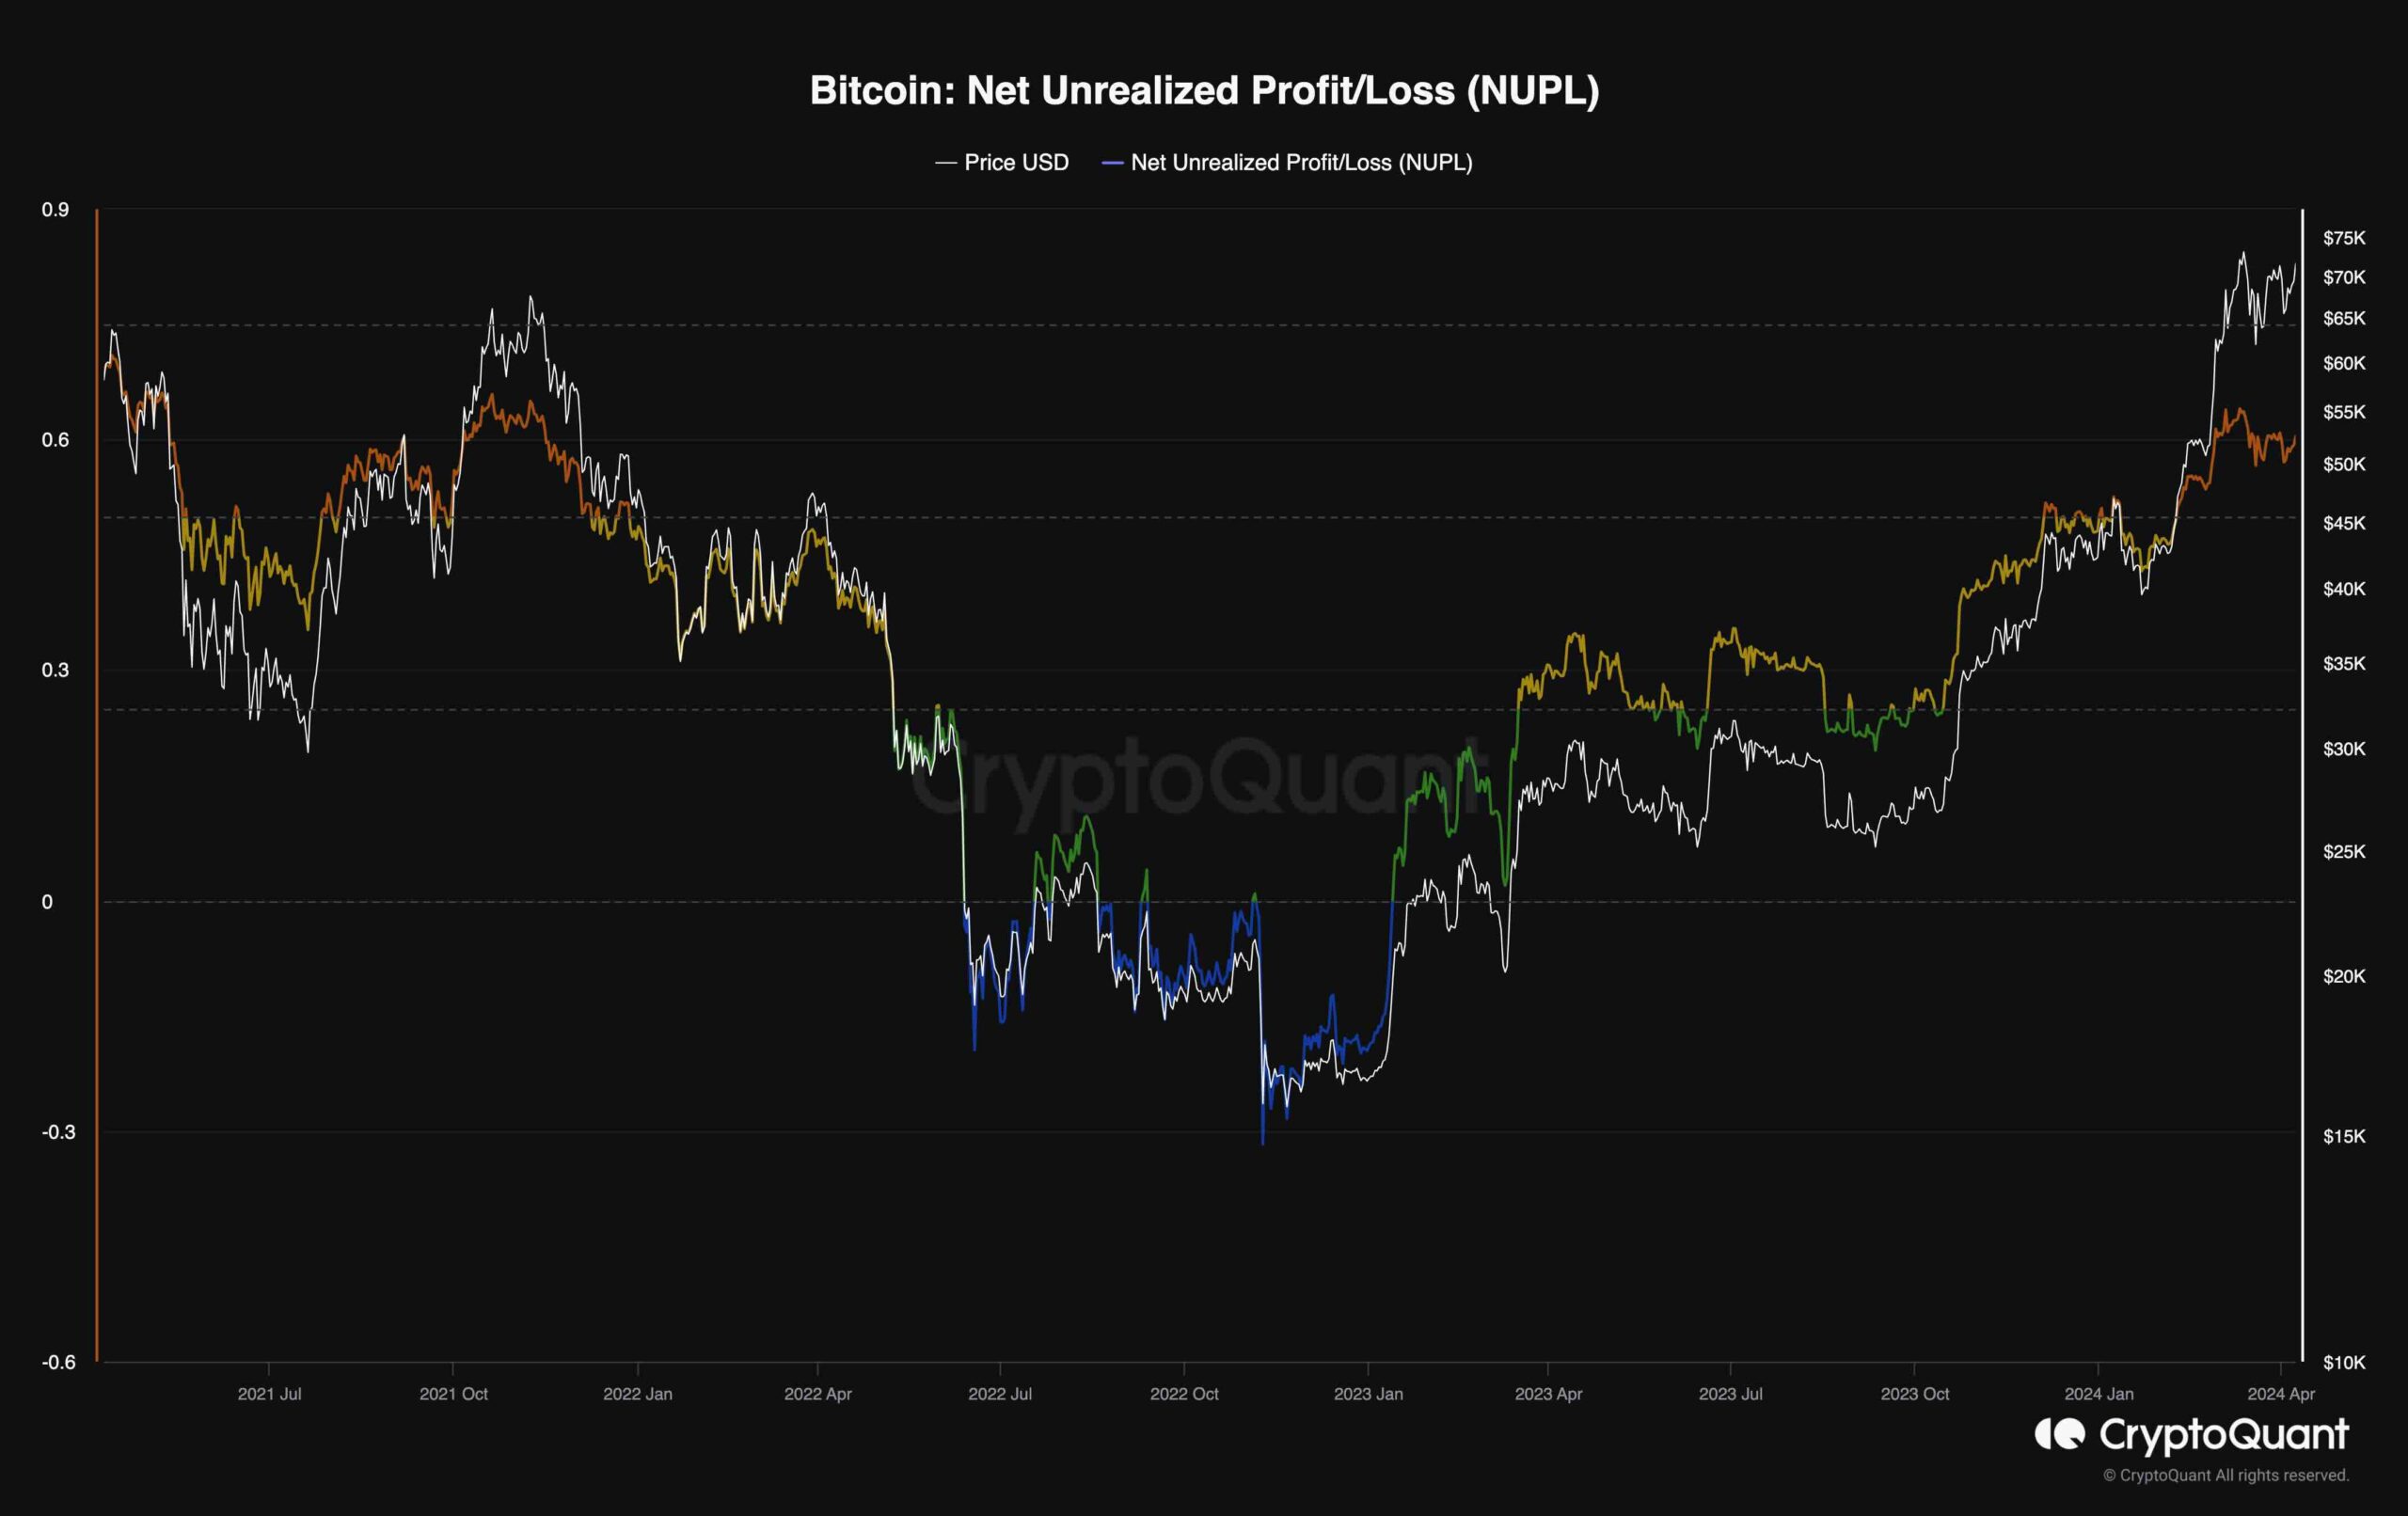
Net Unrealized Profit Loss (NUPL)
As the Bitcoin price has recovered above the $70K level, market participants are expecting BTC to make a new all-time high soon. This optimism can be seen by the holding behavior of investors.
This chart presents the Net Unrealized Profit Loss, which is the difference between market cap and realized cap divided by market cap. Assuming that the latest coin movement results from a purchase, NUPL indicates the total amount of profit/loss in all the coins. So, it could be interpreted as the ratio of investors who are in profit.
As the chart suggests, the NUPL metric shows values above 0.5, which is similar to what was witnessed during the 2022 all-time high. Therefore, while the market can still go higher, the amount of unrealized profits can be worrying, as a mass selling pressure can result in a significant price crash.
The post Bitcoin Itching for a New All-Time High But Bears Defend $72K (BTC Price Analysis) appeared first on CryptoPotato.
Read More

Bitcoin Itching for a New All-Time High But Bears Defend $72K (BTC Price Analysis)
Bitcoin’s price has recovered from the $65K level a few days ago and is en route to making a new all-time high soon.
Technical Analysis
By TradingRage
The Daily Chart
On the daily chart, the price has been forming a large symmetrical triangle pattern. Yet, the market is currently testing the higher boundary of the pattern.
If the price successfully breaks above the upper boundary, a rally toward the $75K level and creating a new all-time high would become increasingly possible. The Relative Strength Index also shows values above 50%, indicating that the momentum is bullish and a price surge is probable.
The 4-Hour Chart
Looking at the 4-hour timeframe, the price has recently broken above the triangle pattern and is currently retesting the broken trendline.
In case of a successful rebound, BTC could rise toward the $75K and probably higher. On the other hand, a drop back inside the triangle would cause the recent breakout to be a fake one. Therefore, a decline toward the lower boundary of the pattern or even the $60K support zone will become likely.
On-Chain Analysis
By TradingRage
Net Unrealized Profit Loss (NUPL)
As the Bitcoin price has recovered above the $70K level, market participants are expecting BTC to make a new all-time high soon. This optimism can be seen by the holding behavior of investors.
This chart presents the Net Unrealized Profit Loss, which is the difference between market cap and realized cap divided by market cap. Assuming that the latest coin movement results from a purchase, NUPL indicates the total amount of profit/loss in all the coins. So, it could be interpreted as the ratio of investors who are in profit.
As the chart suggests, the NUPL metric shows values above 0.5, which is similar to what was witnessed during the 2022 all-time high. Therefore, while the market can still go higher, the amount of unrealized profits can be worrying, as a mass selling pressure can result in a significant price crash.
The post Bitcoin Itching for a New All-Time High But Bears Defend $72K (BTC Price Analysis) appeared first on CryptoPotato.
Read More