ETH Price Analysis: Intraday Bounce Tests Resistance Near $3,300

Share:
Predictions Markets
See what traders are focused on

- ETH price rebounded from $3,127 to $3,357 after the early-January pullback.
- The $3,400 level continues to act as a key resistance, with price yet to hold above it.
The second largest crypto, Ethereum (ETH) is currently trading near the $3,300 level, following a period of steady recovery after a broader decline seen in the previous months. On the daily chart, ETH climbs over 5% but remains below its earlier highs near the $4,000–$4,500 range.
Ethereum has been in a gradual recovery since the start of 2026. On January 6, ETH attempted to push above the $3,350 level but failed to sustain the breakout, leading to a short pullback and consolidation. But recent price action shows signs of stabilization rather than continued weakness. Buyers have been defending the $2,900–$3,000 zone, which has acted as a base during multiple pullbacks.
Today’s session reflects that steady behaviour. Ethereum traded as low as $3,127.13 before moving higher and reaching an intraday high of $3,357.75. The repeated rejection near $3,400 suggests this level remains an important resistance zone.
Ethereum Remains in Short-Term Recovery Phase
From a trend perspective, ETH is trading within a short-term upward range rather than a strong trend. The short-term moving averages have started to turn upward, and price is now trading slightly above them, suggesting improving near-term momentum. However, ETH remains below its longer-term MA, indicating that the broader trend has not fully shifted back to strong bullish conditions yet.
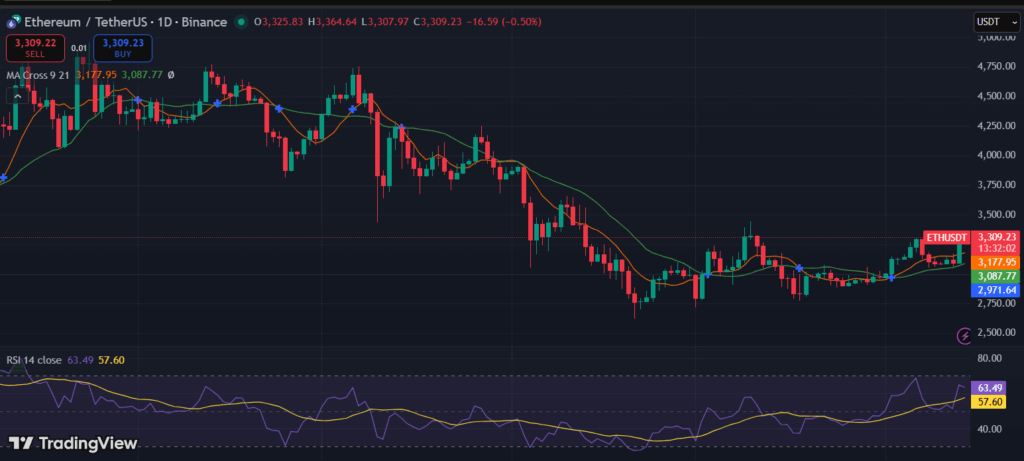
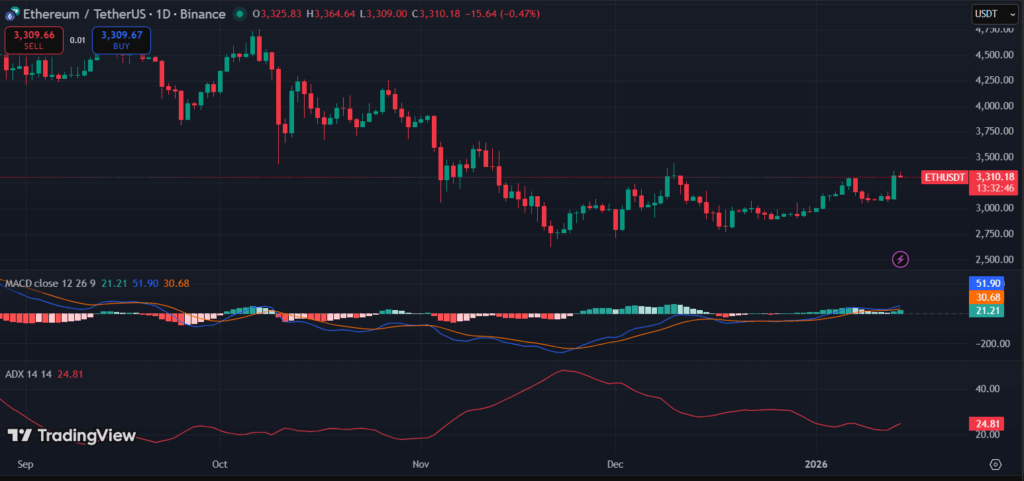
Momentum indicators support this view. The RSI on the daily chart is hovering in the mid-to-high 50s, pointing to neutral-to-positive momentum without entering overbought territory. Meanwhile, the MACD has turned positive, with the signal lines moving upward, which often supports further consolidation or gradual upside if volume remains stable.
Key resistance is visible near $3,400–$3,500, where ETH previously faced selling pressure. A sustained move above this range would be needed to improve the short-term bull power. On the downside, $3,000 remains an important support level, followed by a deeper support zone near $2,800, which previously attracted buyers. Overall, ETH price chart points to cautious recovery rather than a strong trend shift. Holding above key support levels may allow ETH to consolidate further.
Beyond price action, Ethereum also faces structural risks. A recent Bank of Italy study warned that a sharp and prolonged collapse in ETH prices could affect the network’s functionality, potentially freezing more than $800 billion in assets tied to smart contracts, DeFi protocols, and tokenized instruments.


Read More
Bitcoin, XRP, DOGE Rise as US-Iran Technical Talks to Continue Despite Strikes