


Ethereum Price Analysis: ETH Explodes 7% Dailys, is $4K Next?
ETH has recently demonstrated resilience, maintaining support around the critical threshold of $3.2K, leading to a period of consolidation with minimal price movements.
However, there are indications pointing towards a potential surge in buying interest in the medium term, possibly setting Ethereum on a trajectory to surpass its yearly peak of $4.1K.
Technical Analysis
By Shayan
The Daily Chart
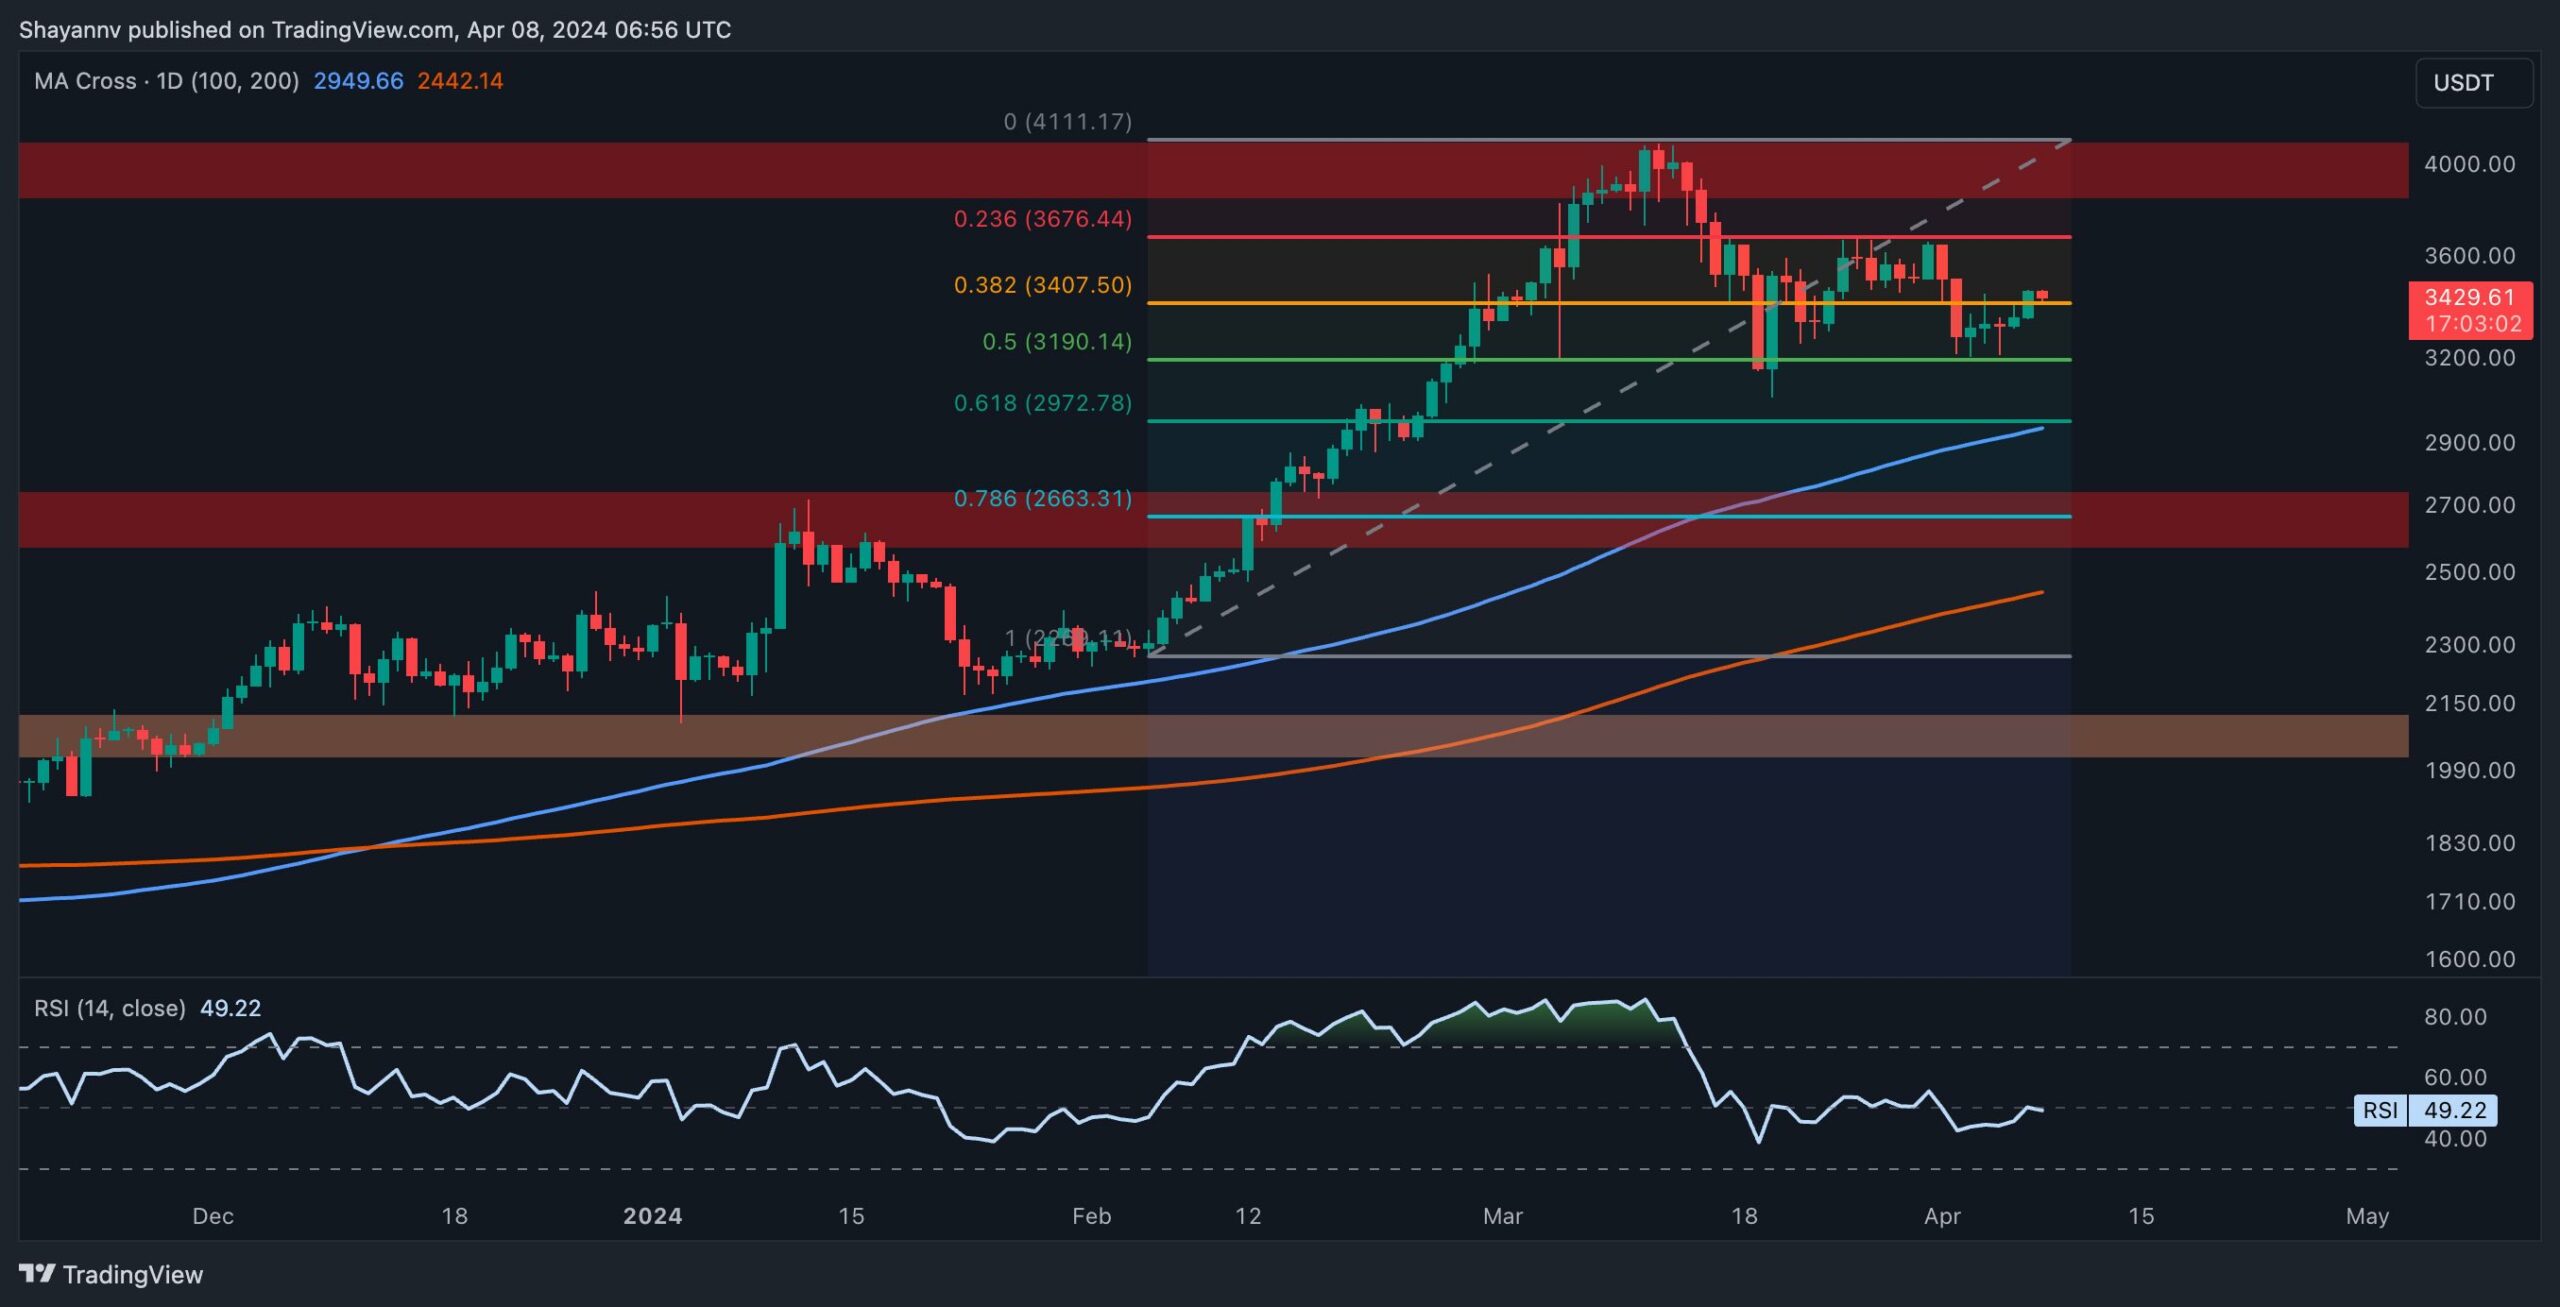
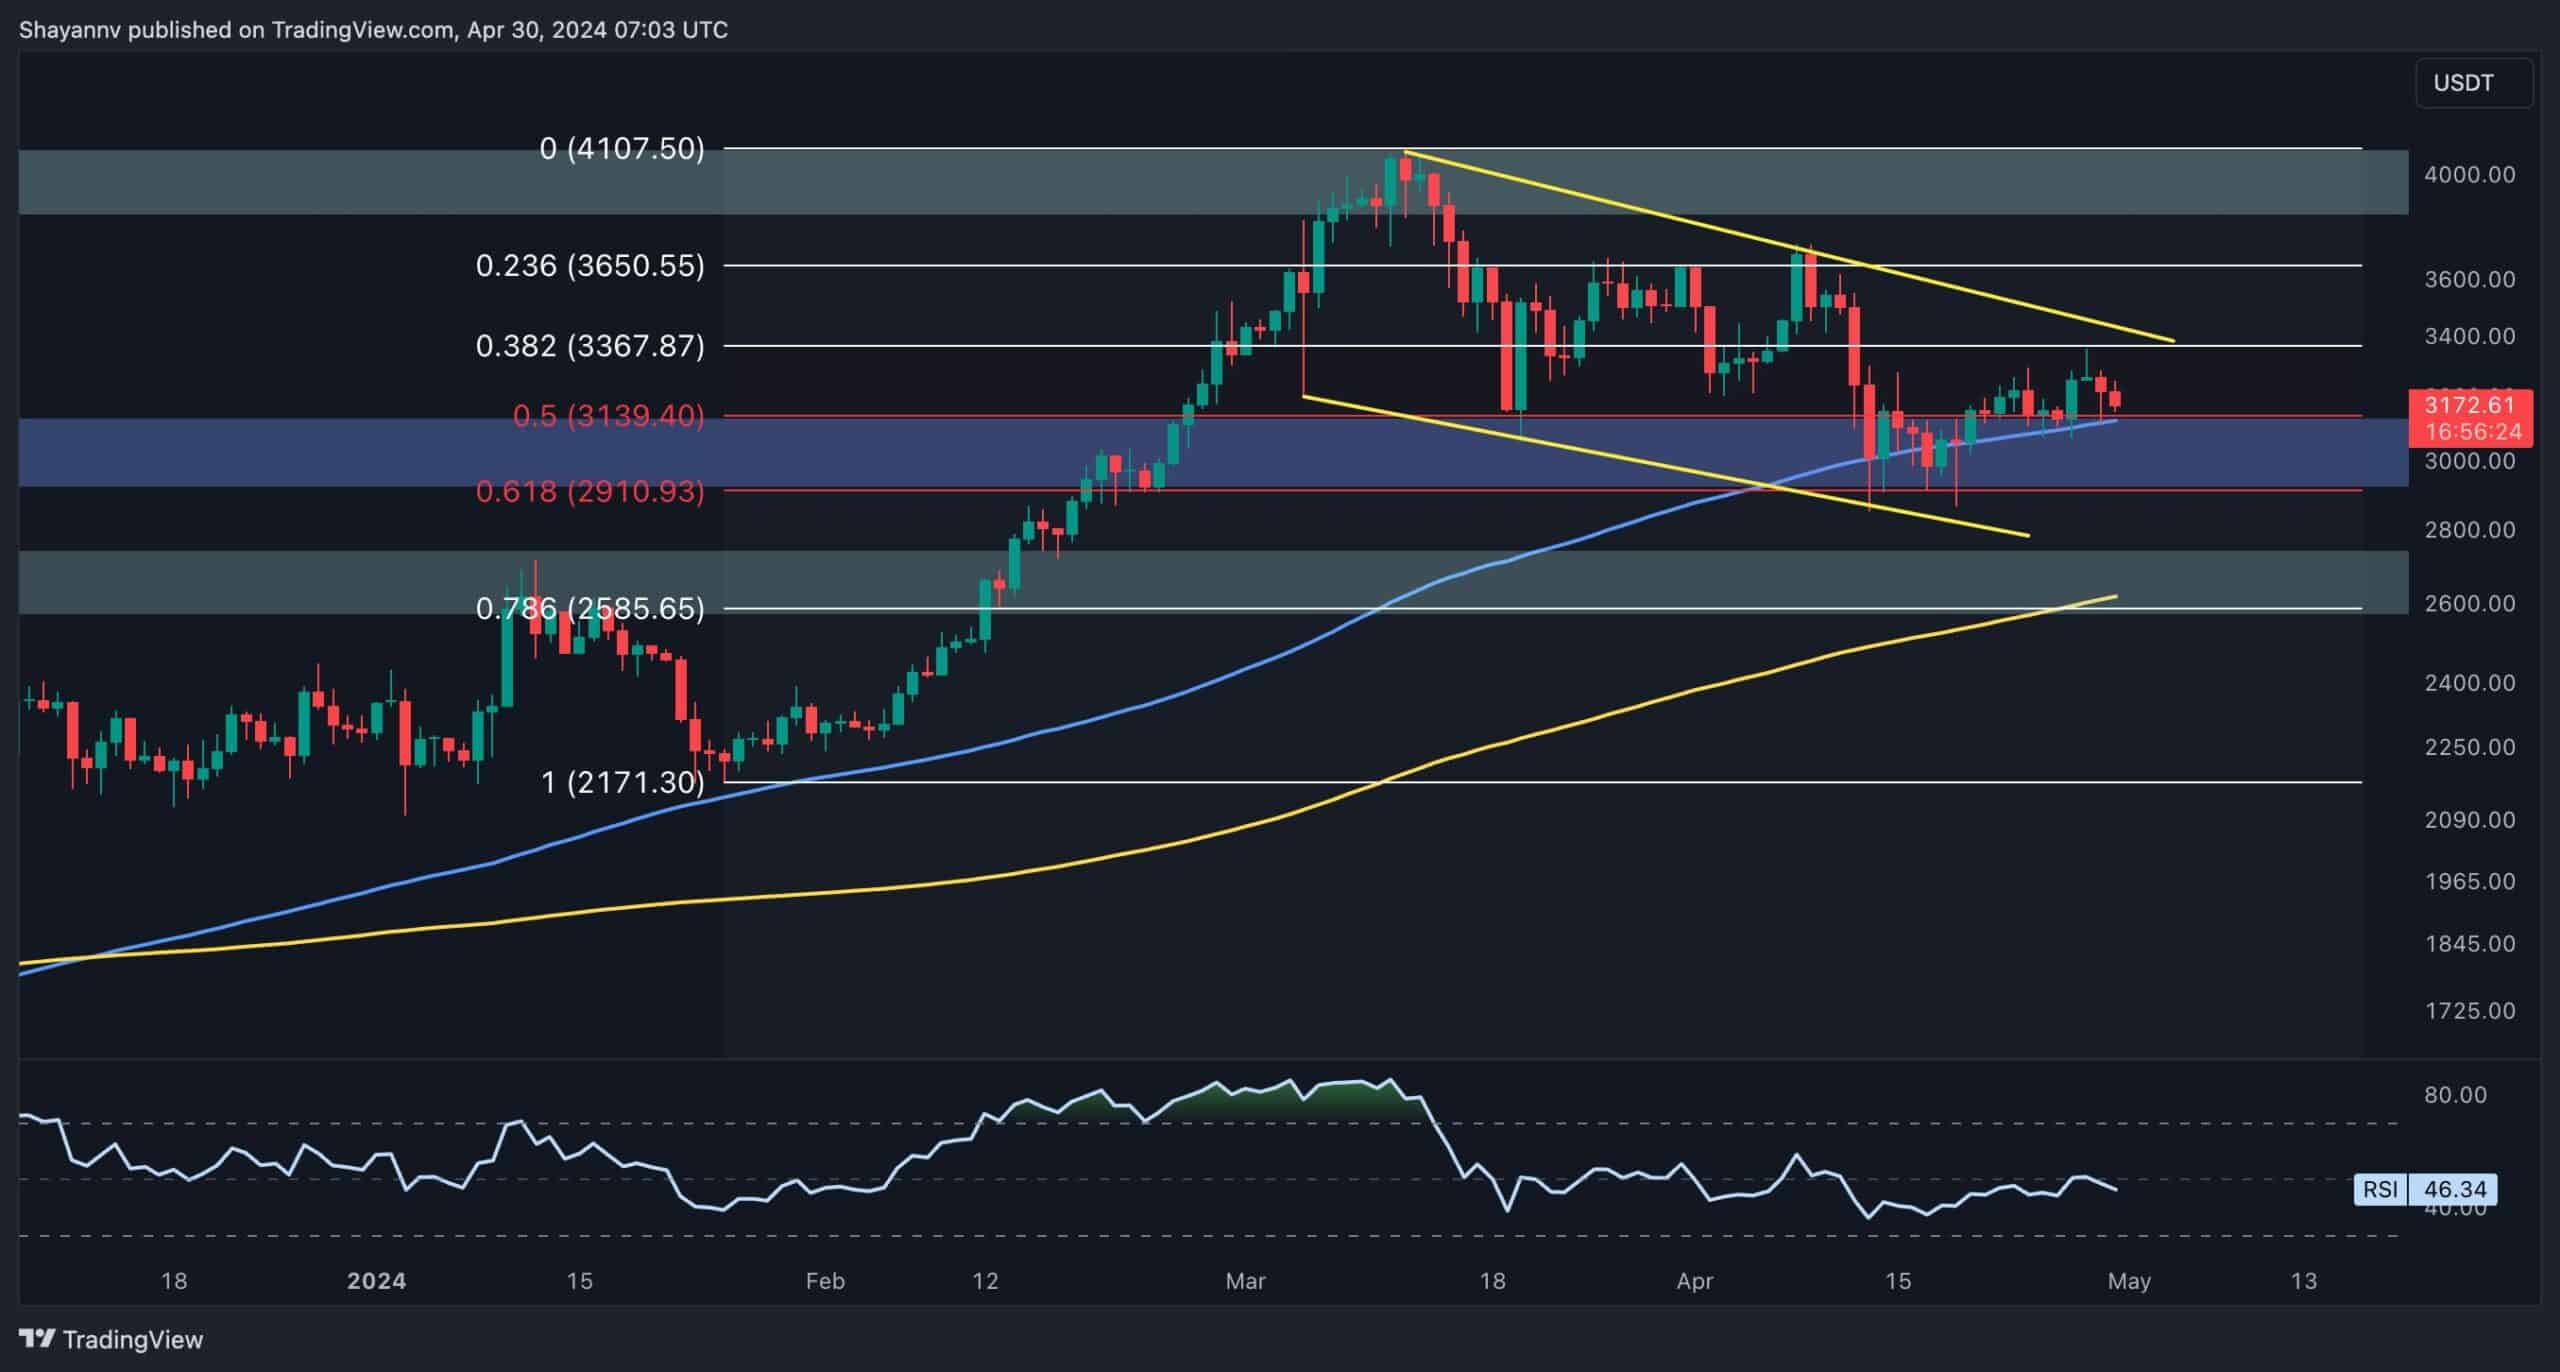
A thorough analysis of the daily chart showcases ETH’s ability to withstand increased selling pressure, finding strong support around the $3.2K mark. This zone coincides with key Fibonacci retracement levels between 0.5 ($3190) and 0.618 ($2972), further fortified by the critical 100-day moving average at $2972.
This confluence of support levels suggests significant hurdles for sellers attempting to drive prices lower, indicating prevalent buying activity and demand in Ethereum’s downward path.
However, ETH is currently in a phase of sideways consolidation, with many market participants anticipating a bullish resurgence aimed at reclaiming the yearly high of $4.1K in the medium term.
The 4-Hour Chart
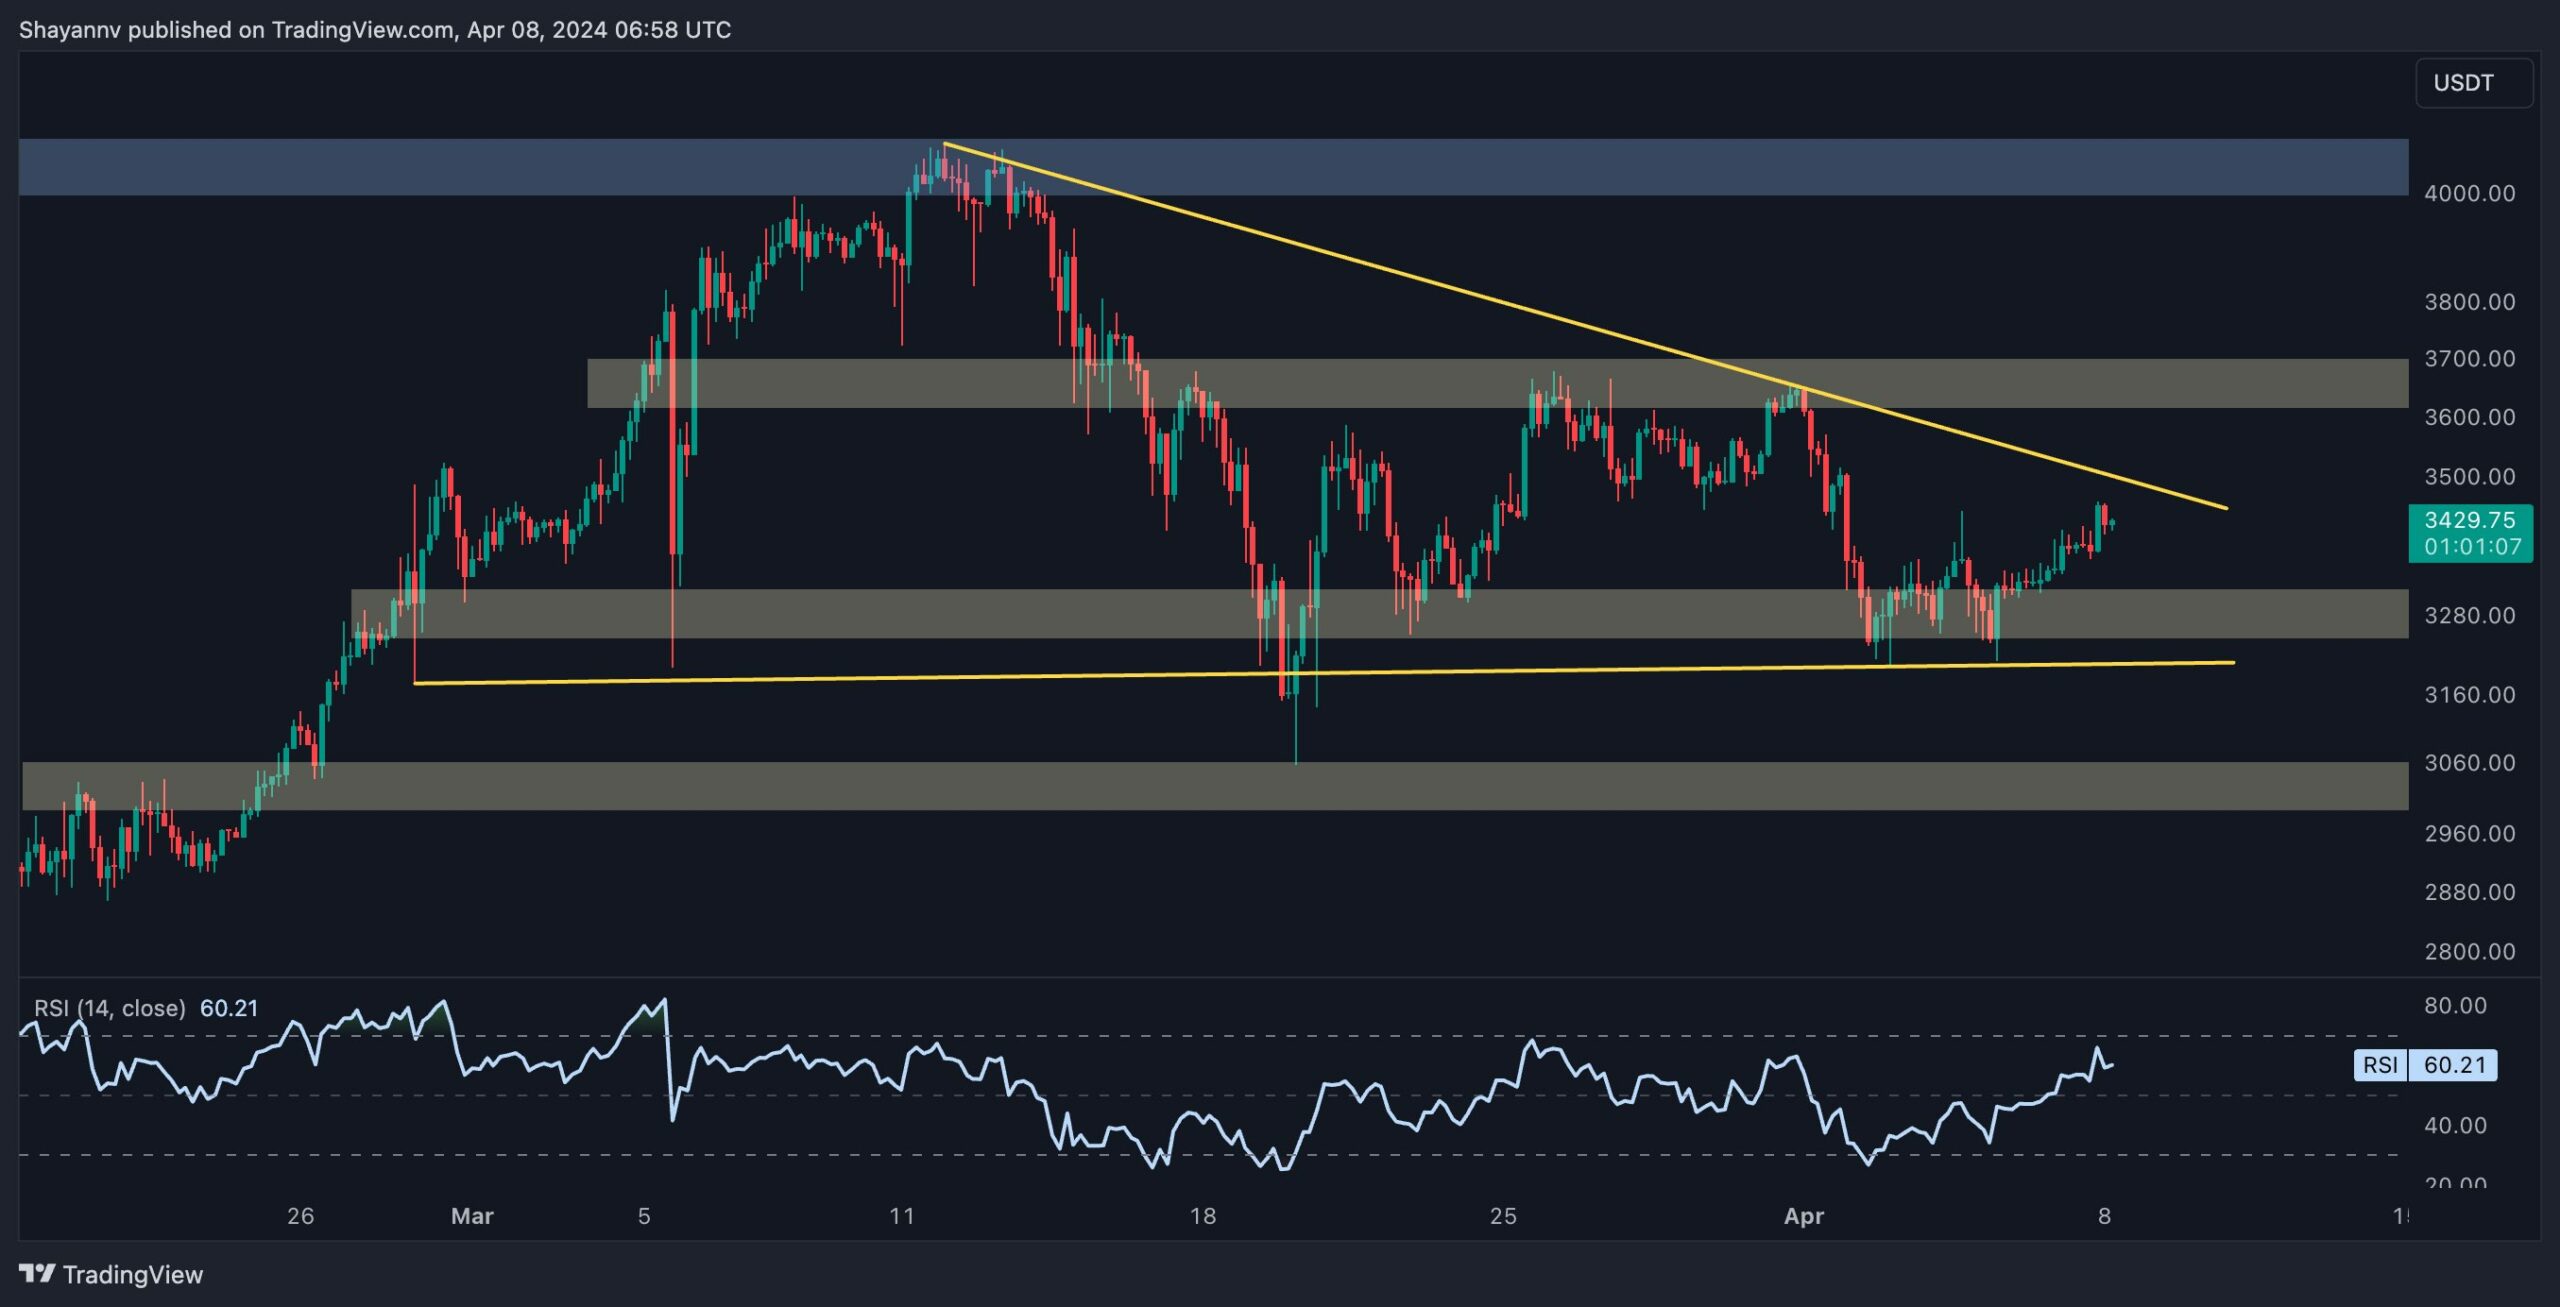
Delving deeper into the 4-hour chart, the formation of a multi-week sideways wedge pattern can be observed, with ETH’s price nearing the apex of this narrowing range. Despite this consolidation, the recent price signals robust buyer presence around the crucial support zone of $3K, resulting in a modest rebound towards the upper boundary of the wedge.
As the cryptocurrency approaches the narrowing range of the pattern, a breakout in either direction seems imminent in the short term. A potential rejection and breach below the wedge’s lower boundary could pave the way for a bearish extension toward the substantial support at $2.9K.
Nevertheless, considering the prevailing market conditions and the dominance of buyers in the perpetual market, a more probable scenario involves a breakout above the pattern, with Ethereum targeting its next resistance at $3.7K.
In general, heightened volatility and significant liquidations in the futures market are expected, necessitating caution among market participants.
On-chain Analysis
By Shayan
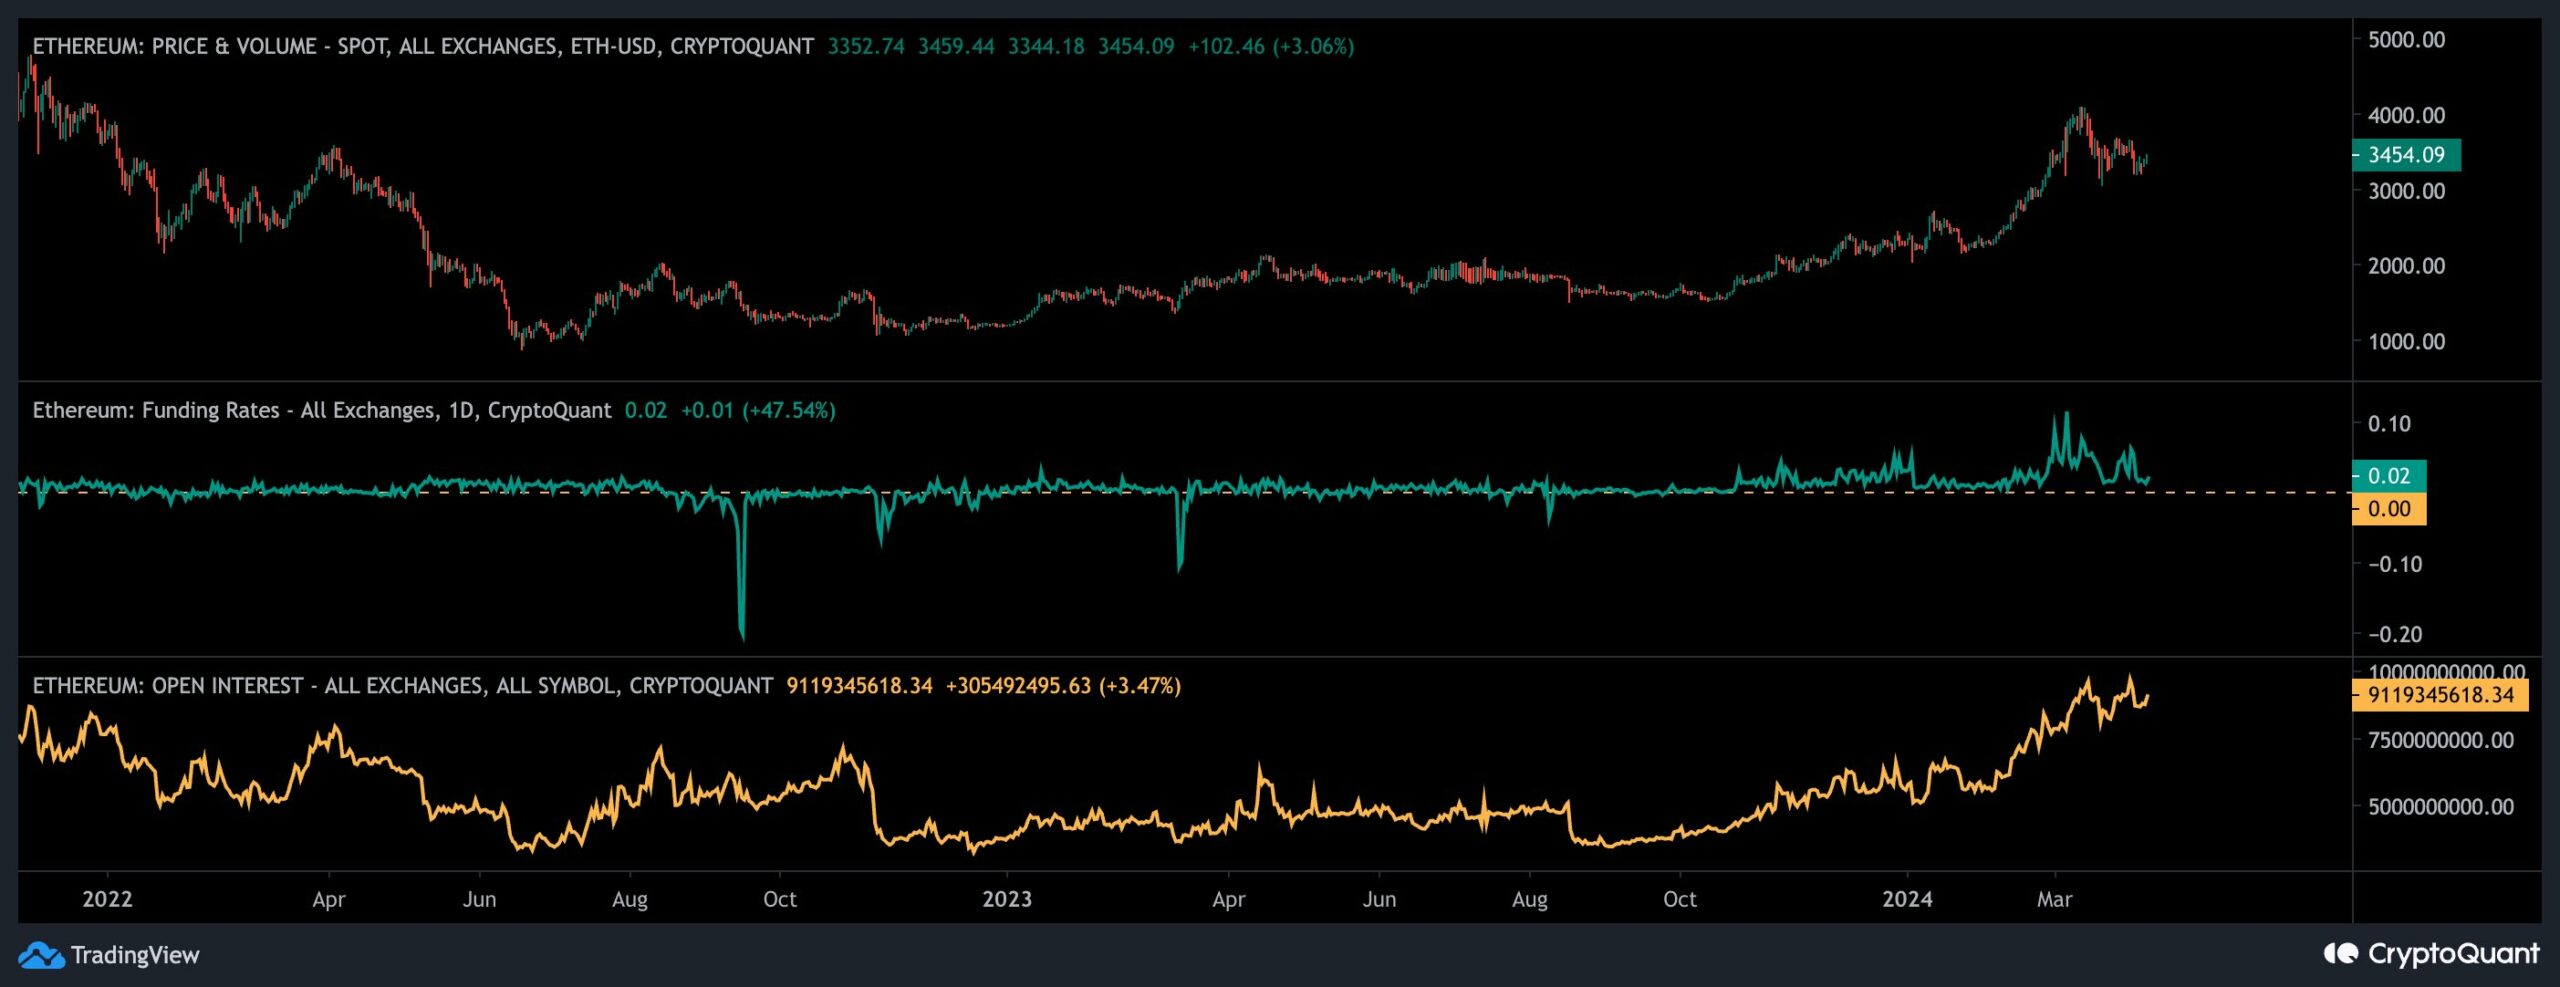
The recent consolidation in Ethereum’s price, following its rapid surge towards the $4K mark, prompts a closer look at sentiment indicators in the futures market to gauge potential future movements. Analyzing the funding rates and Open Interest metric offers valuable insights into the prevailing sentiment among market participants.
The funding rates metric, alongside Open Interest, serves as a barometer for the aggressiveness of buyers and sellers in executing their orders. Overall, positive values in these metrics suggest a bullish sentiment and heightened activity in the perpetual market, while negative values indicate a more cautious or pessimistic stance.
Upon inspection of the chart, it’s notable that as Ethereum’s price experienced a notable uptrend, there was a corresponding spike in the funding rates metric. This indicates an aggressive execution of long positions by participants. Similarly, the uptrend in the Open Interest metric also reflects heightened activity, signalling an overall heated state in the futures market.
Considering these metrics, the market appears poised for another significant move in the mid-term, with the potential for long positions to be reinstated in the perpetual market. This suggests a favourable outlook for Ethereum’s price trajectory, potentially pushing it towards its all-time high.
The post Ethereum Price Analysis: ETH Explodes 7% Dailys, is $4K Next? appeared first on CryptoPotato.
Read More

Ethereum Price Analysis: ETH Explodes 7% Dailys, is $4K Next?
ETH has recently demonstrated resilience, maintaining support around the critical threshold of $3.2K, leading to a period of consolidation with minimal price movements.
However, there are indications pointing towards a potential surge in buying interest in the medium term, possibly setting Ethereum on a trajectory to surpass its yearly peak of $4.1K.
Technical Analysis
By Shayan
The Daily Chart
A thorough analysis of the daily chart showcases ETH’s ability to withstand increased selling pressure, finding strong support around the $3.2K mark. This zone coincides with key Fibonacci retracement levels between 0.5 ($3190) and 0.618 ($2972), further fortified by the critical 100-day moving average at $2972.
This confluence of support levels suggests significant hurdles for sellers attempting to drive prices lower, indicating prevalent buying activity and demand in Ethereum’s downward path.
However, ETH is currently in a phase of sideways consolidation, with many market participants anticipating a bullish resurgence aimed at reclaiming the yearly high of $4.1K in the medium term.
The 4-Hour Chart
Delving deeper into the 4-hour chart, the formation of a multi-week sideways wedge pattern can be observed, with ETH’s price nearing the apex of this narrowing range. Despite this consolidation, the recent price signals robust buyer presence around the crucial support zone of $3K, resulting in a modest rebound towards the upper boundary of the wedge.
As the cryptocurrency approaches the narrowing range of the pattern, a breakout in either direction seems imminent in the short term. A potential rejection and breach below the wedge’s lower boundary could pave the way for a bearish extension toward the substantial support at $2.9K.
Nevertheless, considering the prevailing market conditions and the dominance of buyers in the perpetual market, a more probable scenario involves a breakout above the pattern, with Ethereum targeting its next resistance at $3.7K.
In general, heightened volatility and significant liquidations in the futures market are expected, necessitating caution among market participants.
On-chain Analysis
By Shayan
The recent consolidation in Ethereum’s price, following its rapid surge towards the $4K mark, prompts a closer look at sentiment indicators in the futures market to gauge potential future movements. Analyzing the funding rates and Open Interest metric offers valuable insights into the prevailing sentiment among market participants.
The funding rates metric, alongside Open Interest, serves as a barometer for the aggressiveness of buyers and sellers in executing their orders. Overall, positive values in these metrics suggest a bullish sentiment and heightened activity in the perpetual market, while negative values indicate a more cautious or pessimistic stance.
Upon inspection of the chart, it’s notable that as Ethereum’s price experienced a notable uptrend, there was a corresponding spike in the funding rates metric. This indicates an aggressive execution of long positions by participants. Similarly, the uptrend in the Open Interest metric also reflects heightened activity, signalling an overall heated state in the futures market.
Considering these metrics, the market appears poised for another significant move in the mid-term, with the potential for long positions to be reinstated in the perpetual market. This suggests a favourable outlook for Ethereum’s price trajectory, potentially pushing it towards its all-time high.
The post Ethereum Price Analysis: ETH Explodes 7% Dailys, is $4K Next? appeared first on CryptoPotato.
Read More