Ethereum Price Analysis: Can ETH Overcome Overhead Moving Averages?
Share:
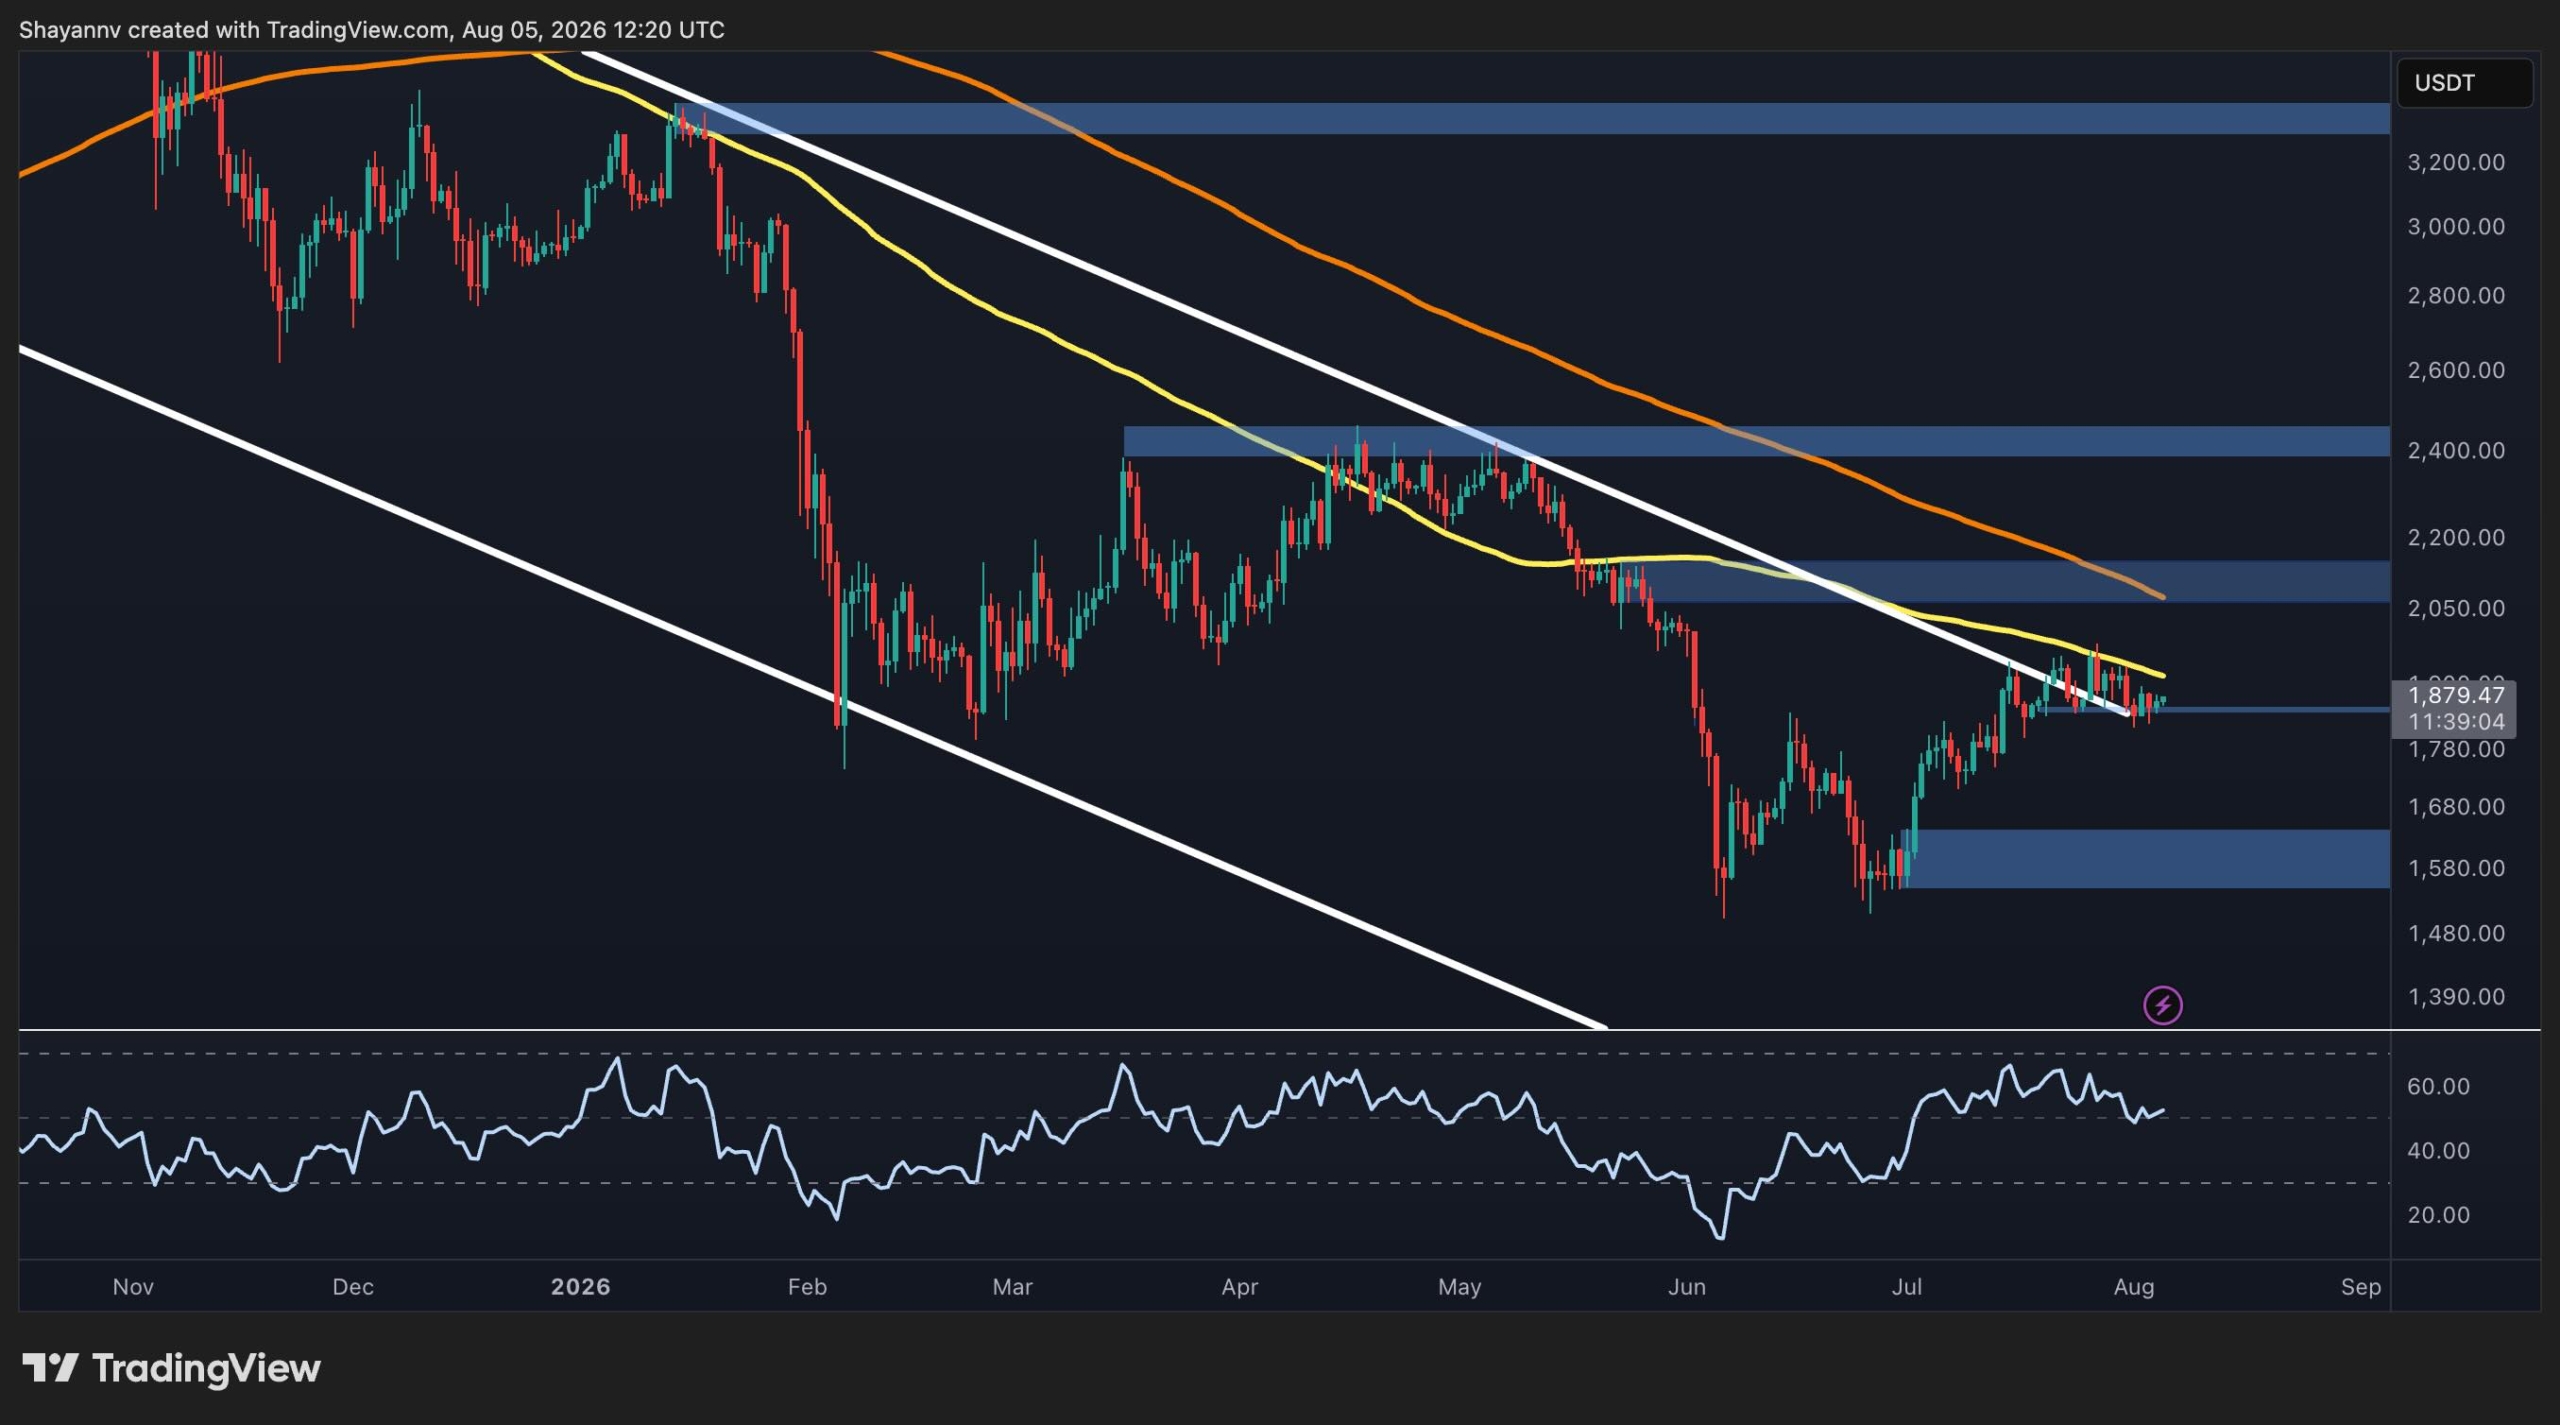
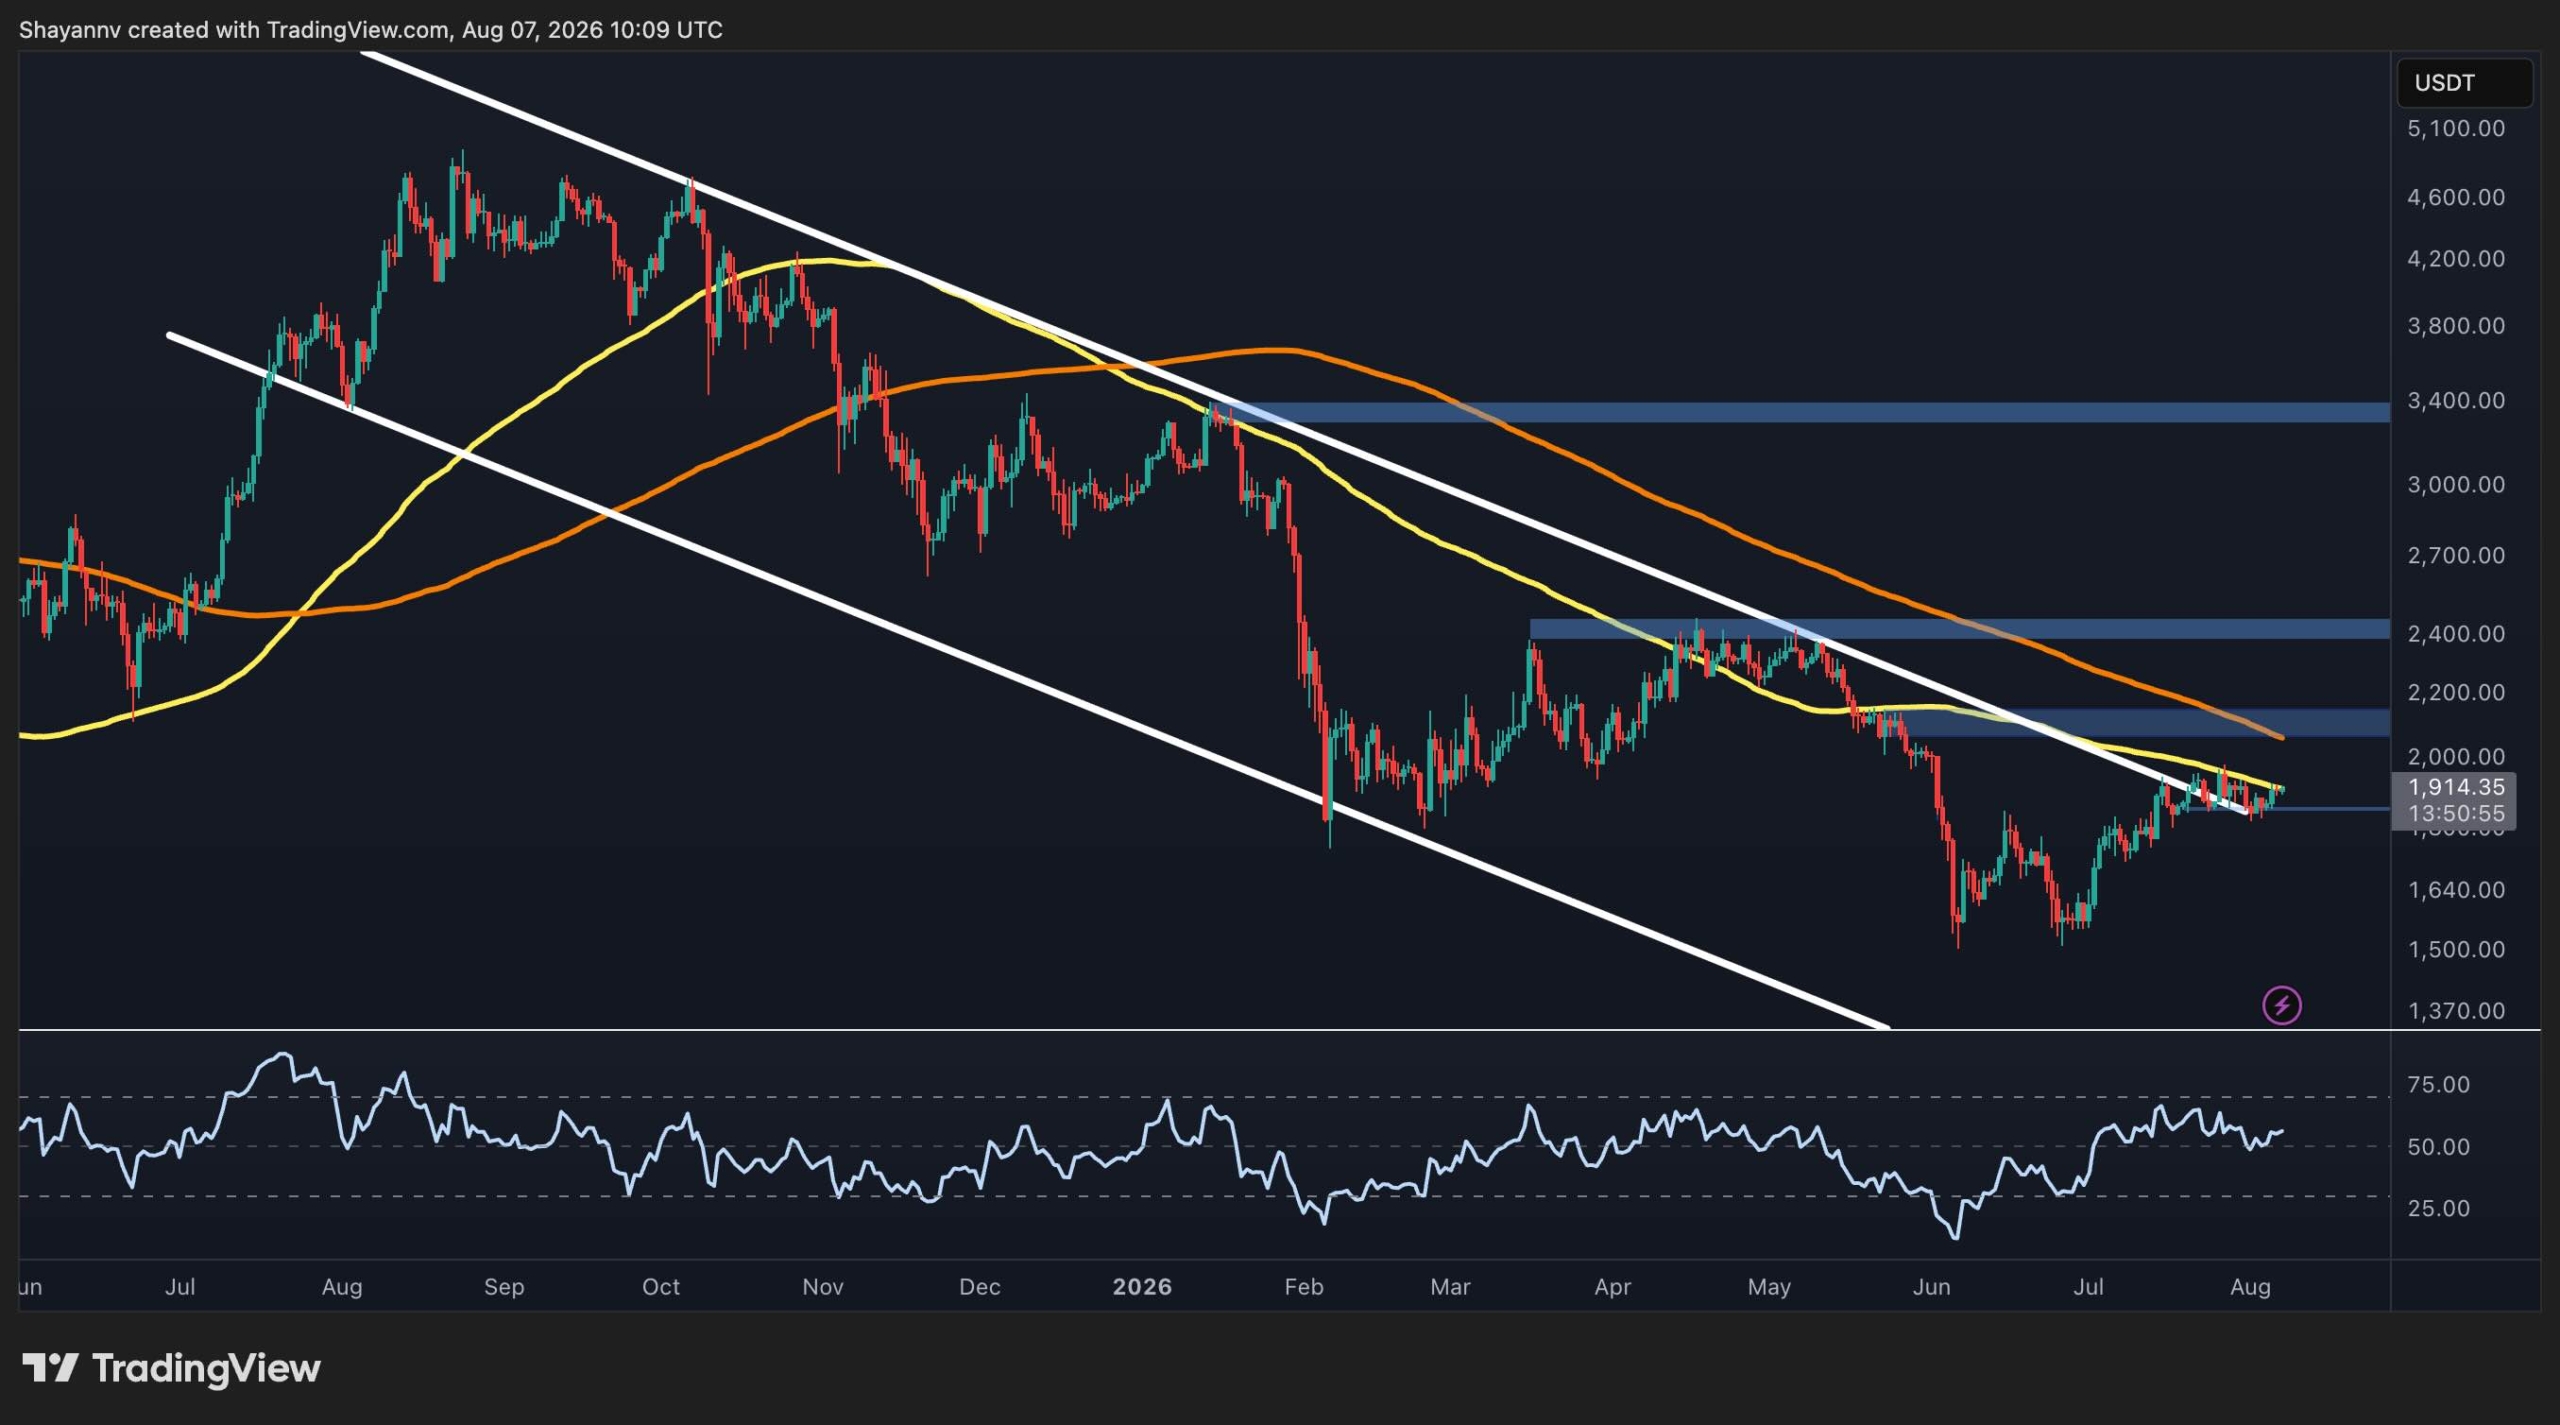
Ethereum (ETH) has stabilized after a sharp correction from yearly highs, with buyers pushing price back toward $1.9K following a breakout from a long-term descending channel. However ETH remains below the 100-day and 200-day moving averages near $1.95K and $2.05K and faces major overhead resistance, leaving the broader market structure bearish and posing downside risk to token performance and DeFi market sentiment.
Predictions Markets
See what traders are focused on

Ethereum has continued to stabilize following its sharp correction from the yearly highs, with buyers attempting to regain control after breaking out of the long-term descending channel. While the recovery has improved the near-term outlook, ETH still faces a cluster of major resistance levels overhead that must be reclaimed before a broader trend reversal can be confirmed.
Ethereum Price Analysis: The Daily Chart
On the daily timeframe, ETH is consolidating just above the broader descending channel’s higher boundary that has guided price action lower for several months. Although buyers have managed to push it back toward $1.9K, the asset is still trading beneath both the 100-day and 200-day moving averages, which are currently converging around the $1.95K and $2.05K levels, respectively. This continues to indicate that the broader market structure remains bearish despite the recent rebound.
In This News
Coins

$ 1.92K
+0.19%
$ 1.92K
+0.22%Predictions Markets
See what traders are focused on
Share:
In This News
Coins
$ 1.92K
+0.19%$ 1.92K
+0.22%Predictions Markets
See what traders are focused on
Share:
Read More

Crypto Price Analysis August-07: ETH, XRP, ADA, BNB, and HYPE