Bitcoin’s Next Big Move? CryptoQuant Says These Alerts Are To Watch

Share:
Predictions Markets
See what traders are focused on

On-chain analytics firm CryptoQuant has revealed the five key Bitcoin on-chain alerts that could be to keep an eye on in the coming week.
Bitcoin Is Observing Developments On These Metrics
In a new thread on X, CryptoQuant has discussed about some Bitcoin on-chain alerts that could be to watch amid the consolidation phase in the cryptocurrency’s price.
The first indicator shared by the analytics firm is the 60-day change in the market cap of USDT, the number one stablecoin.
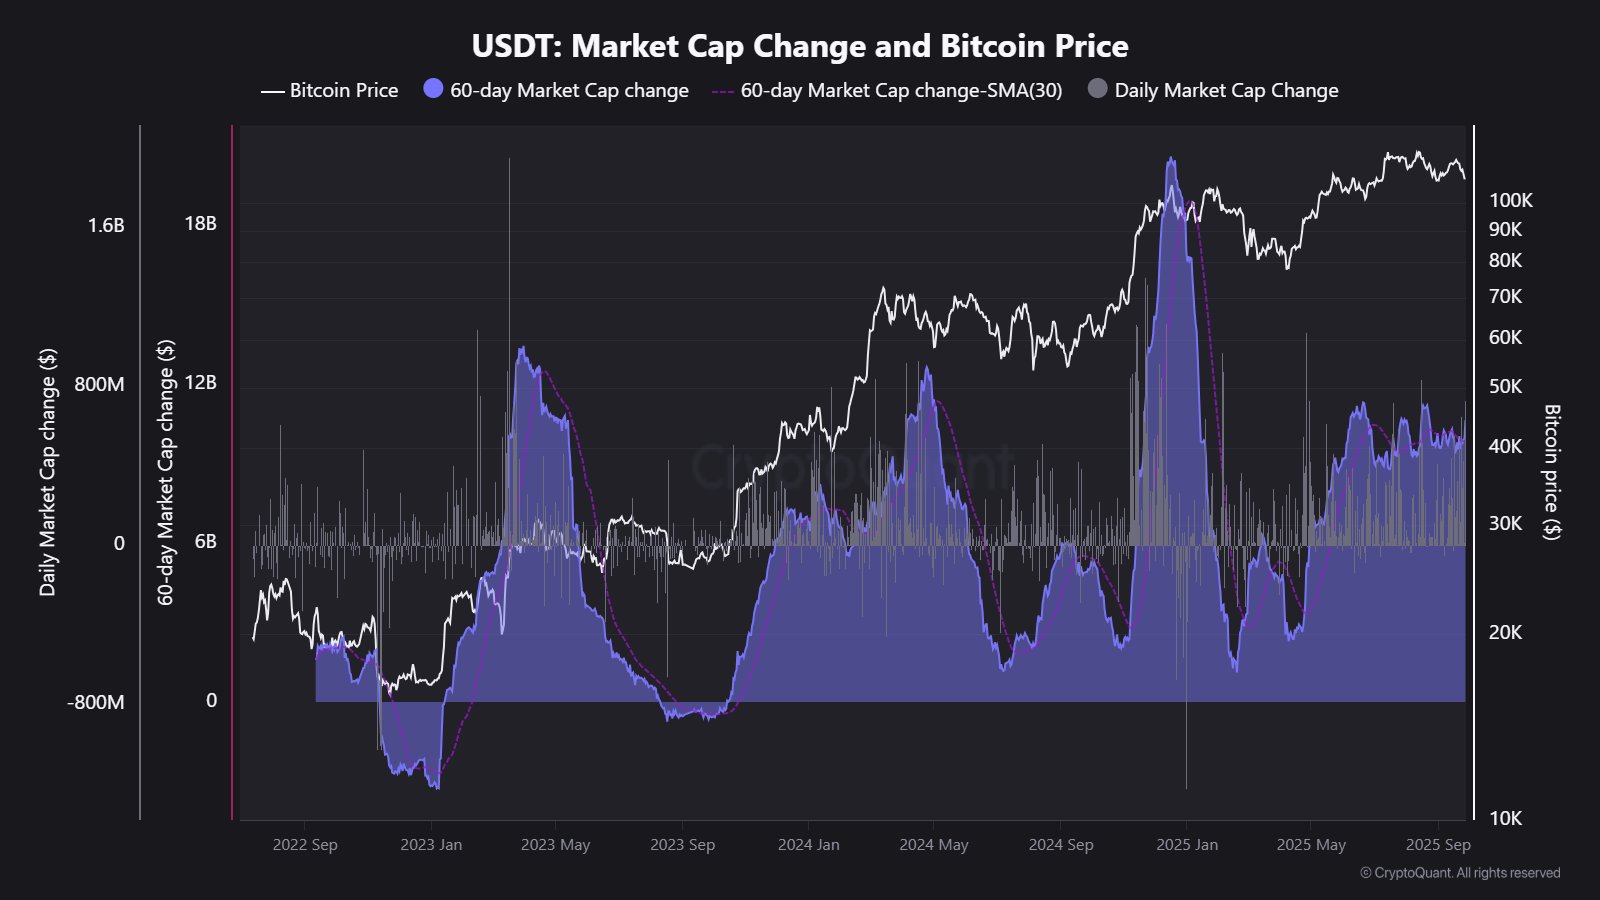
As is visible in the above chart, the 60-day change in the USDT market cap has continued to sit at a notable positive level recently, implying the stablecoin has been witnessing growth.
Stablecoins are one of the main inlets of capital into the cryptocurrency sector, so growth in them can generally be a positive sign. Currently, the 60-day change in the USDT market cap has a value of $10 billion. “This is a clear sign of fresh liquidity entering the market,” notes CryptoQuant.
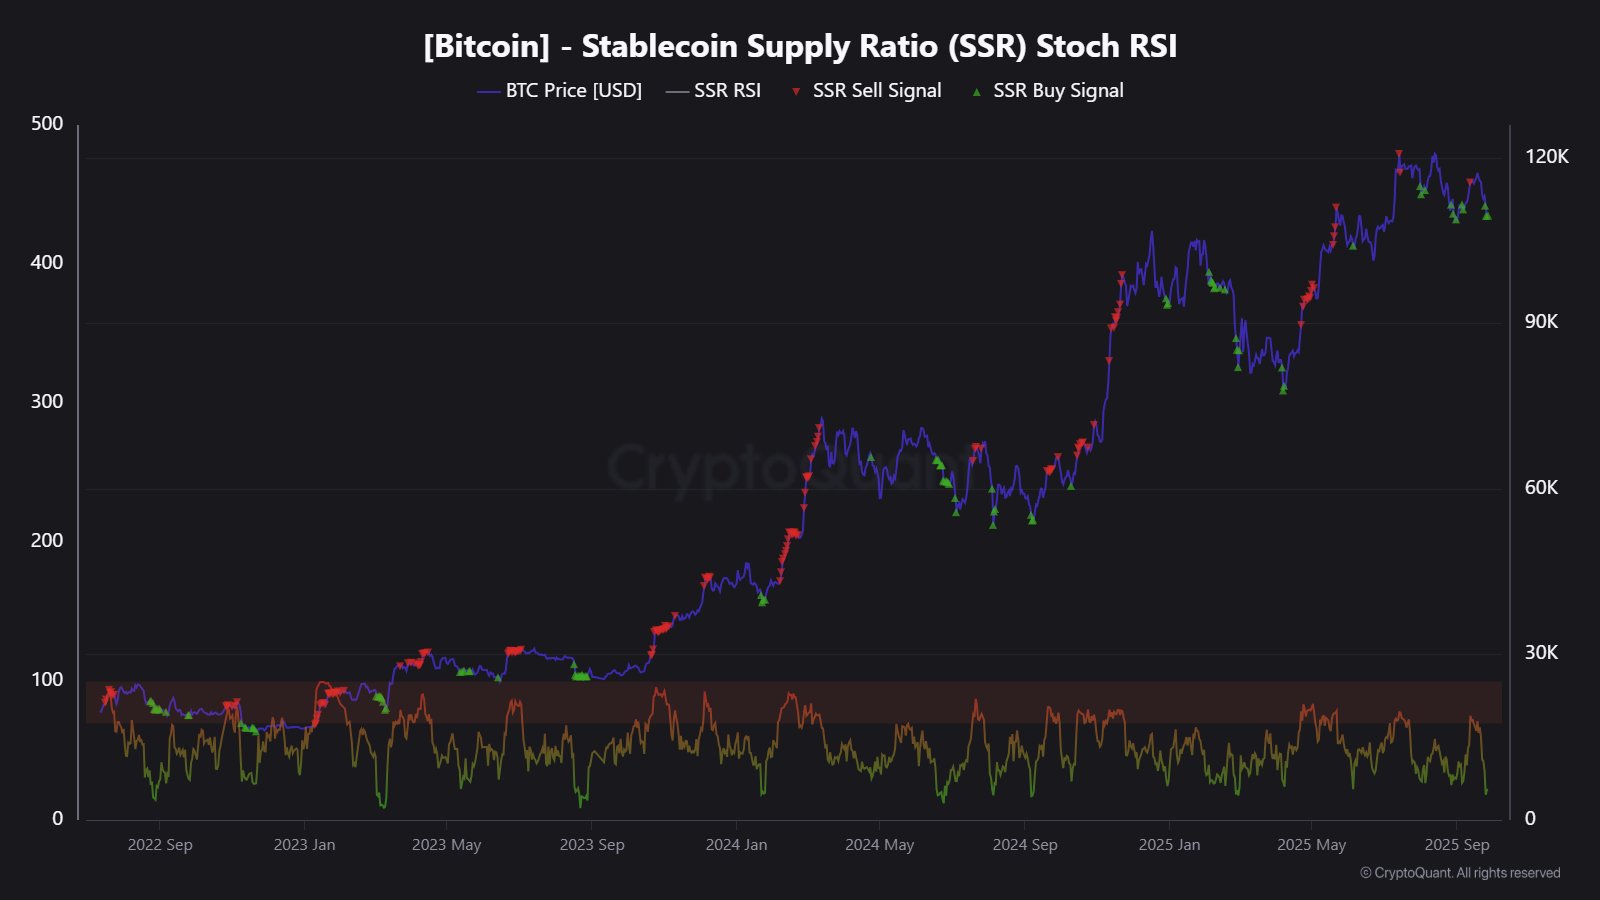
Another stablecoins-related indicator that can be relevant for Bitcoin is the Stablecoin Supply Ratio (SSR), which measures the ratio between the market cap of BTC and combined that of all stables.
A low value in the indicator can prove to be a bullish sign, as it implies investor purchasing power in the form of stablecoins is high compared to the Bitcoin market cap.
From the below chart, it’s apparent that the Relative Strength Index (RSI) of the BTC SSR stands at a value of 21 right now, which is considered to be inside the “buy” territory.
Another bullish sign that’s developing for Bitcoin is in the Accumulator Address Demand, an indicator that measures the demand that’s coming from addresses that have zero history of selling the cryptocurrency. These perennial HODLers now own 298,000 BTC, which is a new record.
A metric that’s still inside the bearish zone, however, is the Inter-Exchange Flow Pulse (IFP). This metric keeps track of the BTC flows happening between spot and derivatives exchanges.
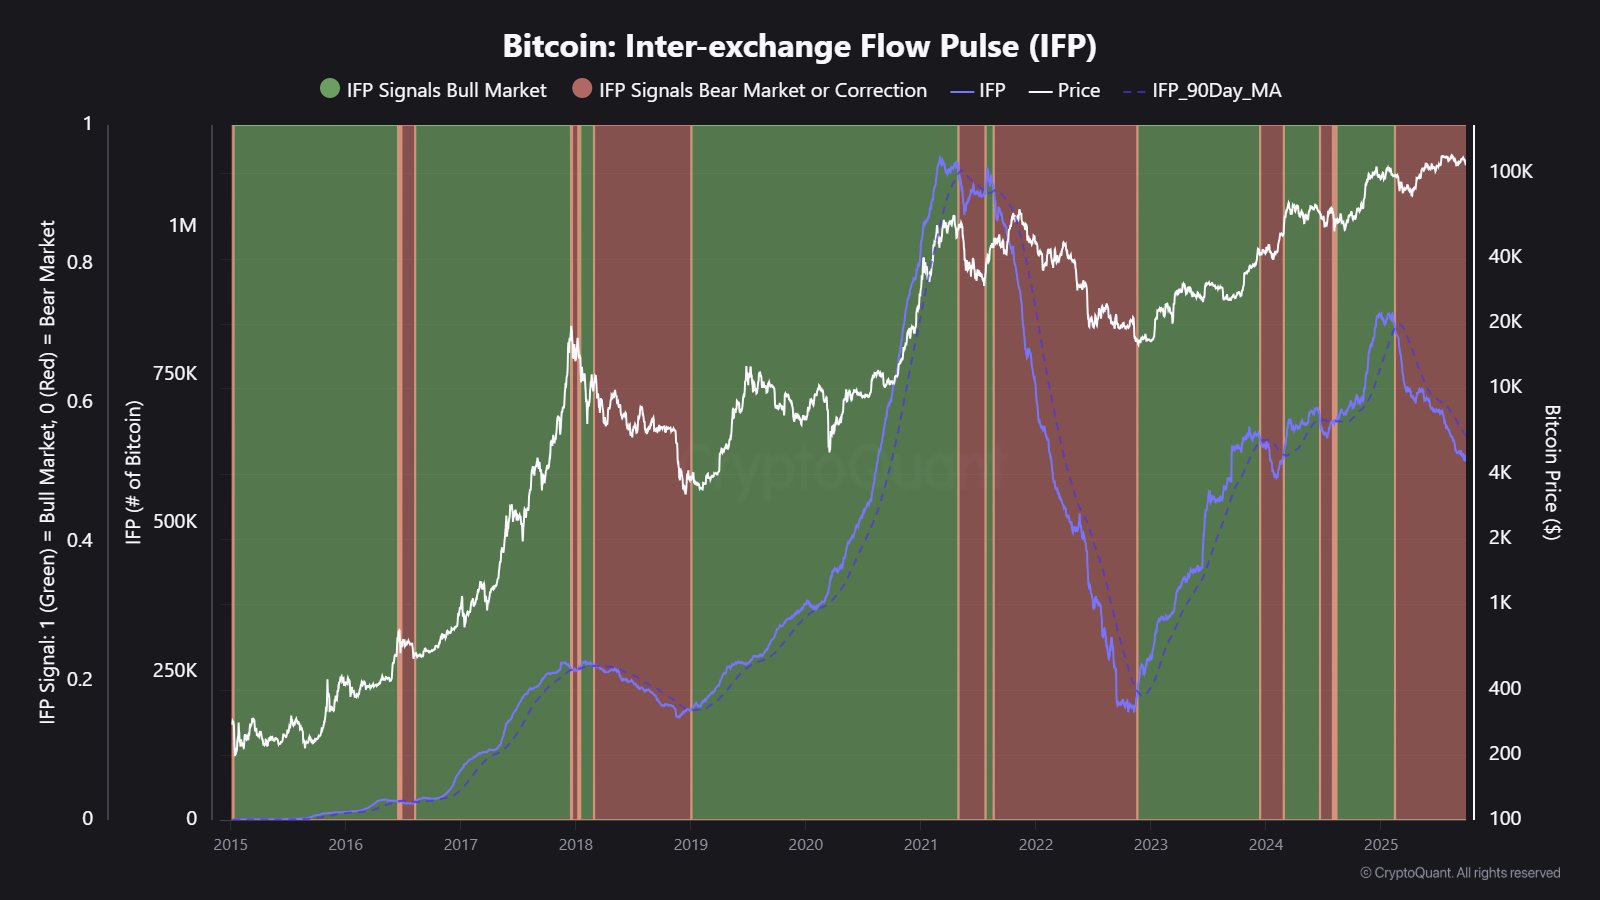
The indicator has been following a downtrend during the past few months, which is considered to be a bear market pattern. “Watch closely: a shift upward often marks the start of bullish momentum,” says the analytics firm.
The final metric shared by CryptoQuant is the Realized Price of the short-term holders (STHs), which measures the average cost basis of the Bitcoin investors who got in during the last 155 days.
During BTC’s recent plunge, the STHs briefly dipped into losses, but the asset has since recovered above their Realized Price of $109,775. Bullish trends have historically continued when the coin has traded above this level.
BTC Price
Bitcoin has climbed back to $114,200 following its recovery surge in the last couple of days.
In This News
Coins

$ 63.88K
+0.94%
$ 0.0774
-0.23%
$ 0.167
-0.19%
$ 0.99922
+0.01%
$ 0.00729
+0.88%


Predictions Markets
See what traders are focused on
Share:
In This News
Coins
$ 63.88K
+0.94%$ 0.0774
-0.23%$ 0.167
-0.19%$ 0.99922
+0.01%$ 0.00729
+0.88%Predictions Markets
See what traders are focused on
Share:
Read More
CryptoQuant Data Shows Bitcoin Historically Strong in July, Signaling Potential Short-Term Rally